Shopify Store Revenue Benchmarks 2026: Traffic, Sales, Apps and Themes Across 300 Busy Stores
 By Assaf ShalinAugust 6, 2026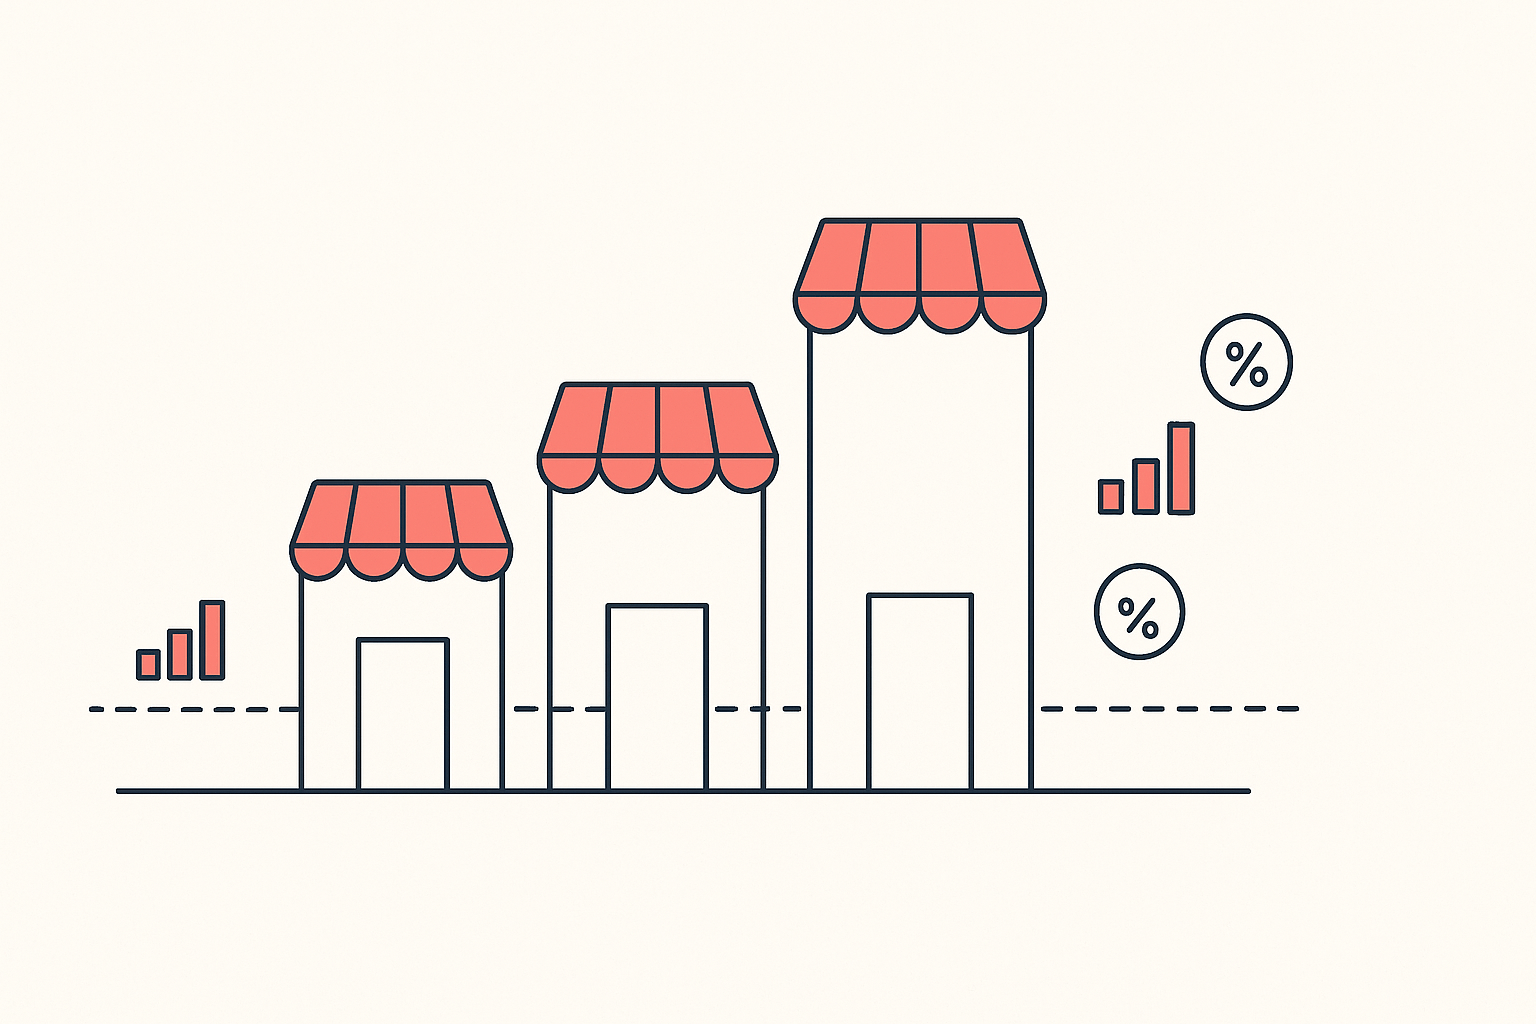
Ask what a Shopify store "should" be doing and you get anecdotes. A screenshot from a course seller, a Reddit thread about somebody's best week, a stat from 2021 that has been recycled so many times nobody remembers the source. None of it tells you whether your traffic is normal, whether your app bill is bloated, or whether the theme you are about to buy is one anybody serious actually runs.
So we built the benchmark from our own data instead.
This report covers the 300 highest-traffic Shopify stores in Koala's store intelligence, as of a snapshot taken on 1 August 2026, alongside app and theme leaderboards drawn from the wider set of stores Koala tracks. Every figure below is Koala's own. Nothing is borrowed, modeled backwards from a press release, or rounded up to sound better.
What is in the sample
The store cohort is the 300 busiest stores Koala tracks, ranked by modeled monthly visits. That is a deliberate choice and it changes how you read everything that follows: these are not first-week stores. The smallest store in the cohort still pulls 26,101 modeled monthly visits. Treat these numbers as the shape of an established business, and treat your own store as early if it sits below the bottom of the range.
The app and theme leaderboards come from a wider pool, counting how many of the stores in Koala's data run each app and each theme. Coverage is the stores Koala tracks, which is a large sample of active Shopify merchants rather than every store on the platform, so read the leaderboards as rankings within our data.
Traffic and modeled sales: the spread is the story
Here is the distribution across the cohort. Visits are modeled monthly sessions; sales are modeled monthly gross revenue.
| Percentile | Modeled monthly visits | Modeled monthly sales |
|---|---|---|
| 10th | 30,297 | $227,777 |
| 25th | 37,746 | $289,517 |
| 50th (median) | 59,472 | $396,317 |
| 75th | 113,774 | $593,501 |
| 90th | 273,477 | $1,418,105 |
| 95th | 530,190 | $2,388,881 |
| Largest store | 3,763,535 | $16,263,030 |
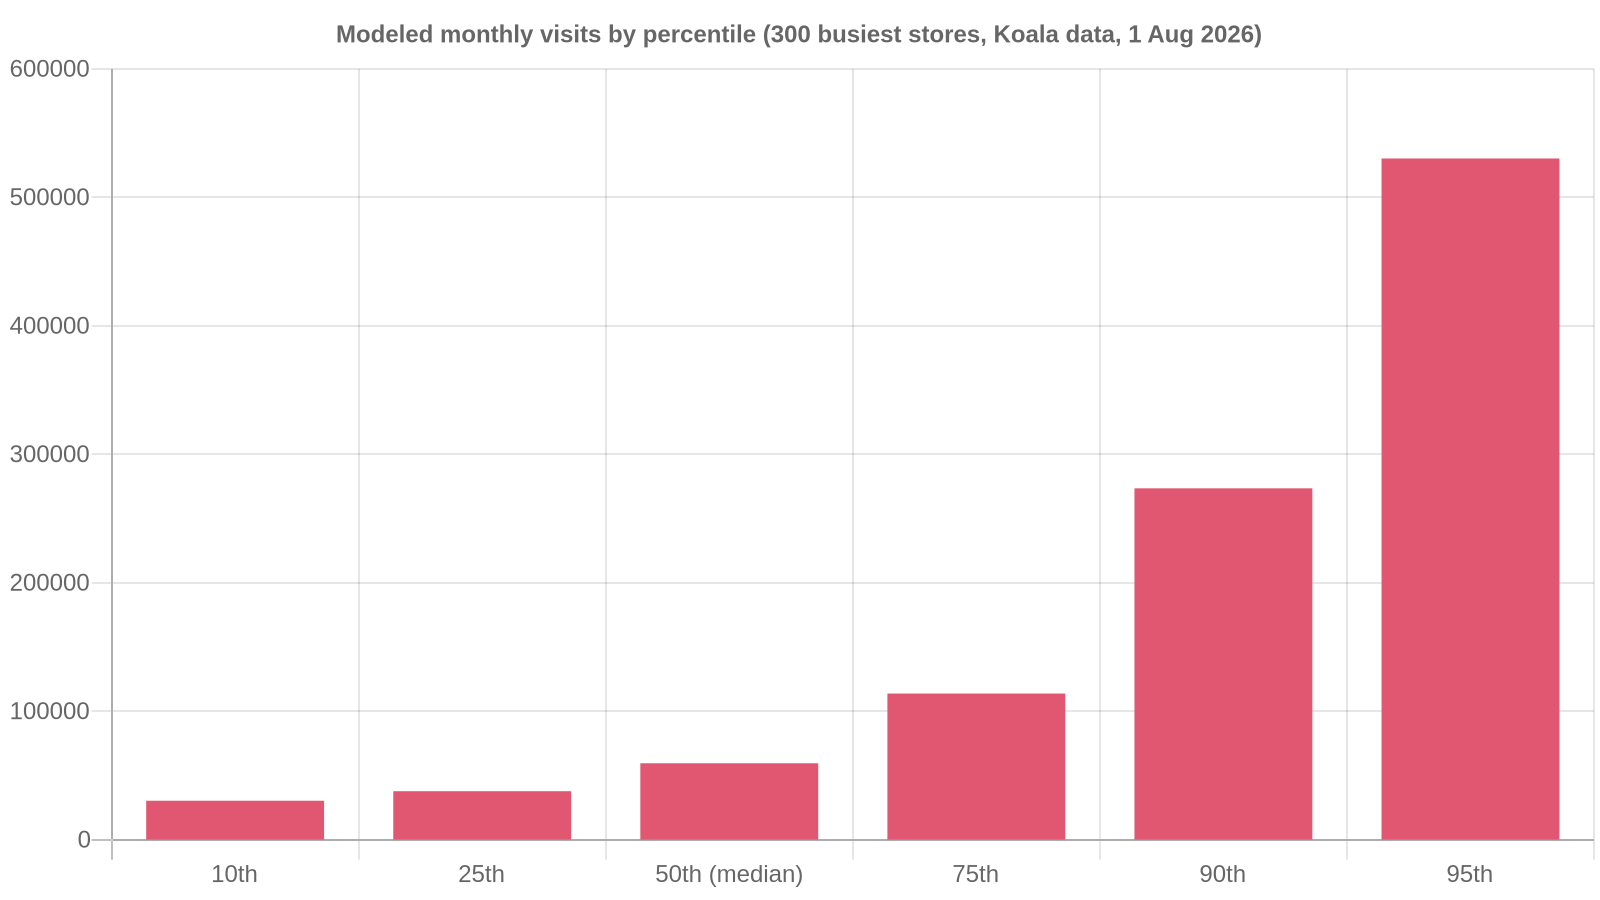
The median is useful. The gap above it is more useful. A store at the 90th percentile of this cohort does 4.6 times the traffic of the median store, and the largest store does 63 times the median. Half the cohort sits in a fairly tight band between roughly 38,000 and 114,000 visits a month, and then the curve goes vertical.
That shape has a practical consequence. If you benchmark yourself against "the top Shopify stores," you are benchmarking against the far right of a curve that almost nothing sits on. The realistic target for a store that is working is the 59,472 visit, $396,317 median, and the honest description of the stores above it is that they are a different category of business.
Two cautions on the sales column. These are modeled estimates of gross sales, so they are directional and they are revenue before product cost, shipping, fees and ad spend. Use them to compare stores and spot scale, never as accounting. If you want to sanity check a number against your own margins, our Shopify revenue calculator does that arithmetic.
App stacks: how many, and what they cost
This is the section that surprised us.
The median store in the cohort runs 11 apps. The quartiles are 6 and 16, the 90th percentile is 21, and the heaviest store runs 39. Median monthly app spend is $51.99, which works out to roughly $4.20 per installed app per month.
| Metric | 10th | 25th | Median | 75th | 90th | Maximum |
|---|---|---|---|---|---|---|
| Installed apps | 4 | 6 | 11 | 16 | 21 | 39 |
| Monthly app spend | $9.98 | $19.98 | $51.99 | $111.98 | $361.17 | $1,099.96 |
Now split the cohort into four traffic quartiles and watch what happens.
| Traffic quartile | Median monthly visits | Median apps | Median app spend |
|---|---|---|---|
| Q1 (smallest) | 31,084 | 10 | $49.48 |
| Q2 | 47,245 | 11 | $55.00 |
| Q3 | 80,568 | 10 | $49.99 |
| Q4 (largest) | 218,950 | 11 | $49.99 |
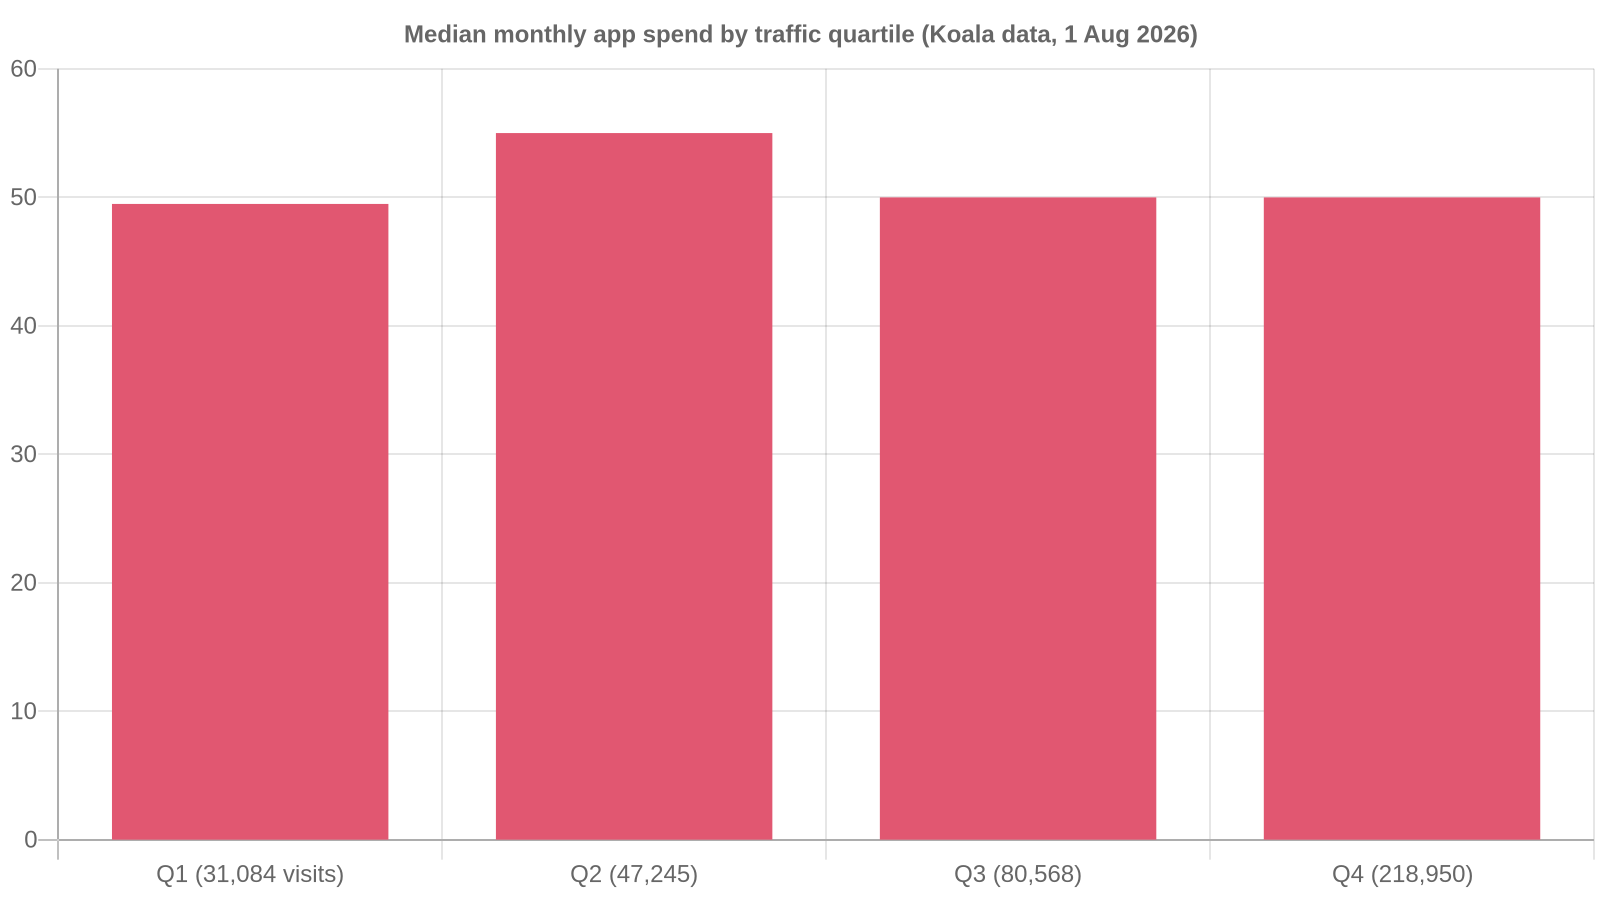
Traffic rises sevenfold from the smallest quartile to the largest. Median app spend does not move. Median app count does not move either, and across the whole cohort the correlation between how many apps a store runs and how much traffic it gets is 0.09, which is another way of saying there is no relationship at all.
App spend scales in the tail, not in the middle. The top decile of spenders in the largest quartile runs $471.13 a month against $328.90 in the smallest, and the single biggest bill in the cohort is $1,099.96. So the pattern is that a handful of large stores buy expensive infrastructure, while the typical busy store, at any size, runs about a dozen apps for about fifty dollars.
Read that against what merchants say about their own stacks. One seller who audited 50 random Shopify stores for speed and app bloat reported finding $80 to $200 a month going to apps that did not drive revenue. Against a $51.99 median, a bill in that range means you are paying more than the busy stores do, and you are almost certainly paying it for apps you stopped using.
The app leaderboard
Counting how many of the stores Koala tracks run each app, as of the 1 August snapshot:
| # | App | Category | Tracked stores running it |
|---|---|---|---|
| 1 | Judge.me Product Reviews App | Product reviews | 3,338 |
| 2 | Klaviyo: Email Marketing & SMS | Email marketing | 2,523 |
| 3 | Klarna On-Site Messaging | Banners | 1,429 |
| 4 | Shopify Inbox | Chat | 1,408 |
| 5 | PageFly Landing Page Builder | Page builder | 1,130 |
| 6 | Instafeed - Instagram Feed | Social proof | 1,073 |
| 7 | Product Reviews | Product reviews | 1,066 |
| 8 | Loox - Product Reviews App | Product reviews | 1,014 |
| 9 | Microsoft Clarity: AI Insights | Analytics | 983 |
| 10 | Shopify Forms | Email marketing | 972 |
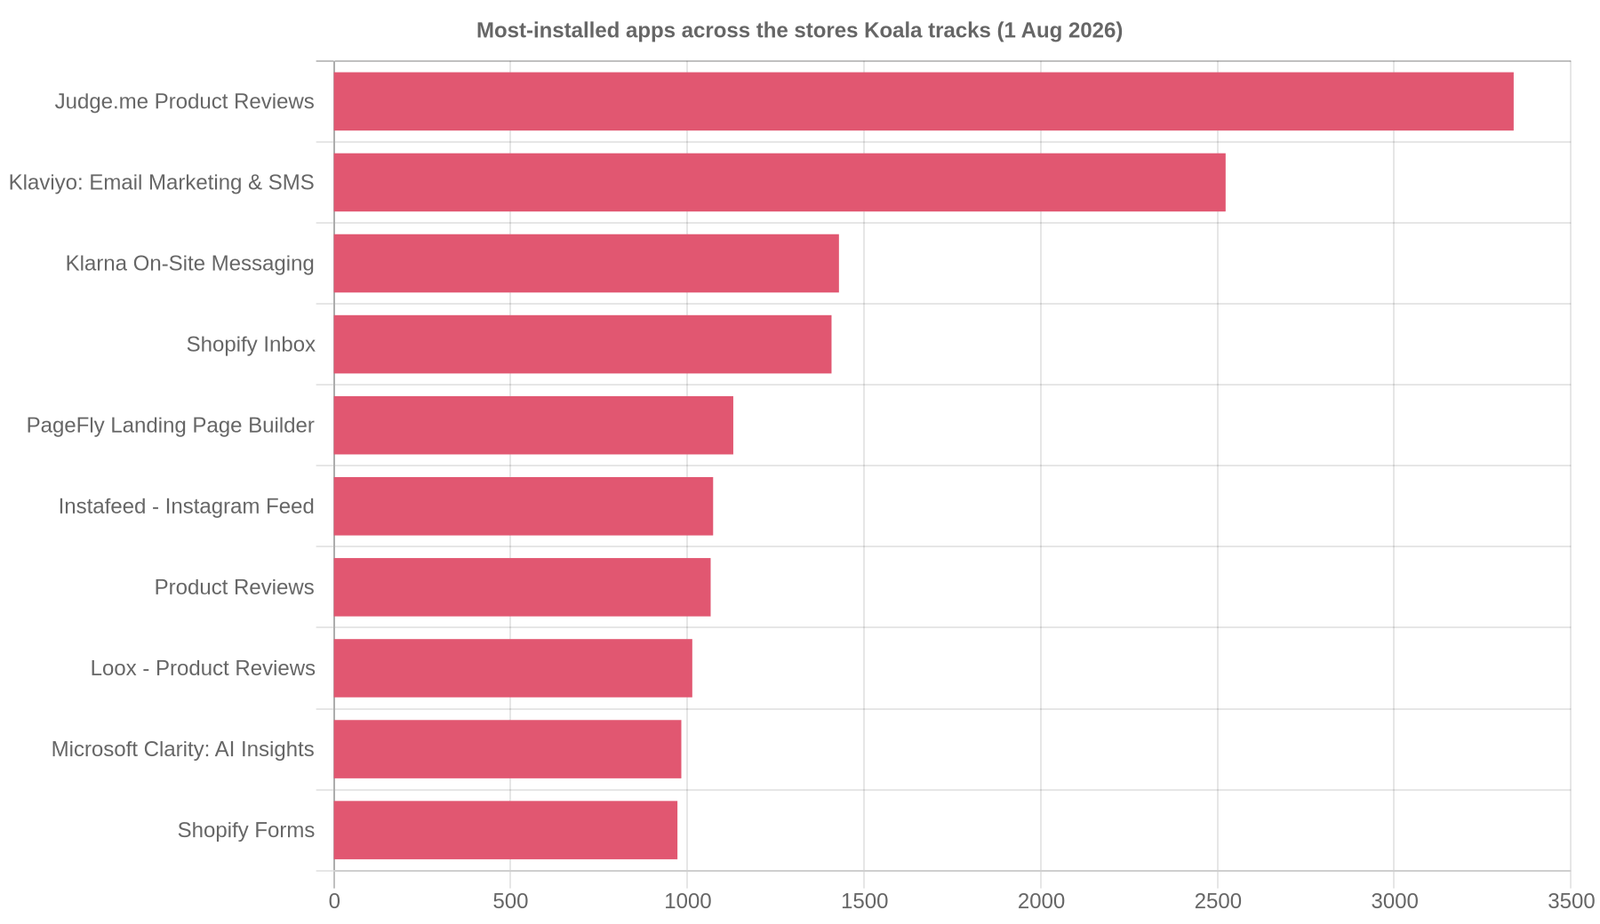
Three of the top ten are review apps, and that is not a coincidence of naming. Group the whole 250-app leaderboard by what each app does and product reviews is the single largest category by installs, with 7,580 installs spread across 21 different review apps. Email marketing is second at 5,553 installs across 11 apps. Then page builders (2,384), chat (2,290), analytics (2,020) and order tracking (2,000).
The jobs busy stores pay to solve, in order, are: prove the product is good, own the customer list, control the landing page, answer questions, measure, and tell people where the parcel is. If your stack does not cover the first two, you are missing what the market has already decided is essential. Our deeper breakdown of what apps top Shopify stores use goes category by category.
The theme leaderboard
| # | Theme | Tracked stores running it |
|---|---|---|
| 1 | Trademark | 1,239 |
| 2 | Dawn | 994 |
| 3 | Horizon | 599 |
| 4 | Impulse | 367 |
| 5 | Rise | 363 |
| 6 | Savor | 345 |
| 7 | Prestige | 326 |
| 8 | Tinker | 311 |
| 9 | Refresh | 305 |
| 10 | Publisher | 281 |
Two things worth knowing about this table.
Dawn and Horizon, at second and third, are both free themes designed by Shopify. Dawn is the minimalist one that lets product images carry the page; Horizon is the newer free theme built around a clean setup so a store can launch faster. Between them they account for 1,593 of the stores in this snapshot, which is more than the entire paid top five combined. The free option is the mainstream option.
And the theme at number one, Trademark, has no listing in Shopify's theme store at all. It leads the ranking anyway, which is a reminder that a theme's popularity and its shelf presence are separate facts. Our full ranking of the most-used Shopify themes covers the long tail below this top ten.
Benchmarks by category
The same cohort, cut by the store's primary category. Only categories with at least eight stores in the sample are shown, so the medians mean something.
| Category | Stores | Median monthly visits | Median modeled monthly sales | Median apps | Median app spend |
|---|---|---|---|---|---|
| Apparel | 56 | 55,128 | $384,037 | 11 | $55.00 |
| Home & Garden | 55 | 54,871 | $379,380 | 10 | $38.48 |
| Beauty & Fitness | 28 | 173,820 | $901,337 | 11 | $80.25 |
| Food & Drink | 25 | 63,924 | $410,448 | 11 | $59.50 |
| Sports | 17 | 55,367 | $382,805 | 10 | $63.99 |
| Health | 13 | 41,748 | $315,820 | 14 | $74.00 |
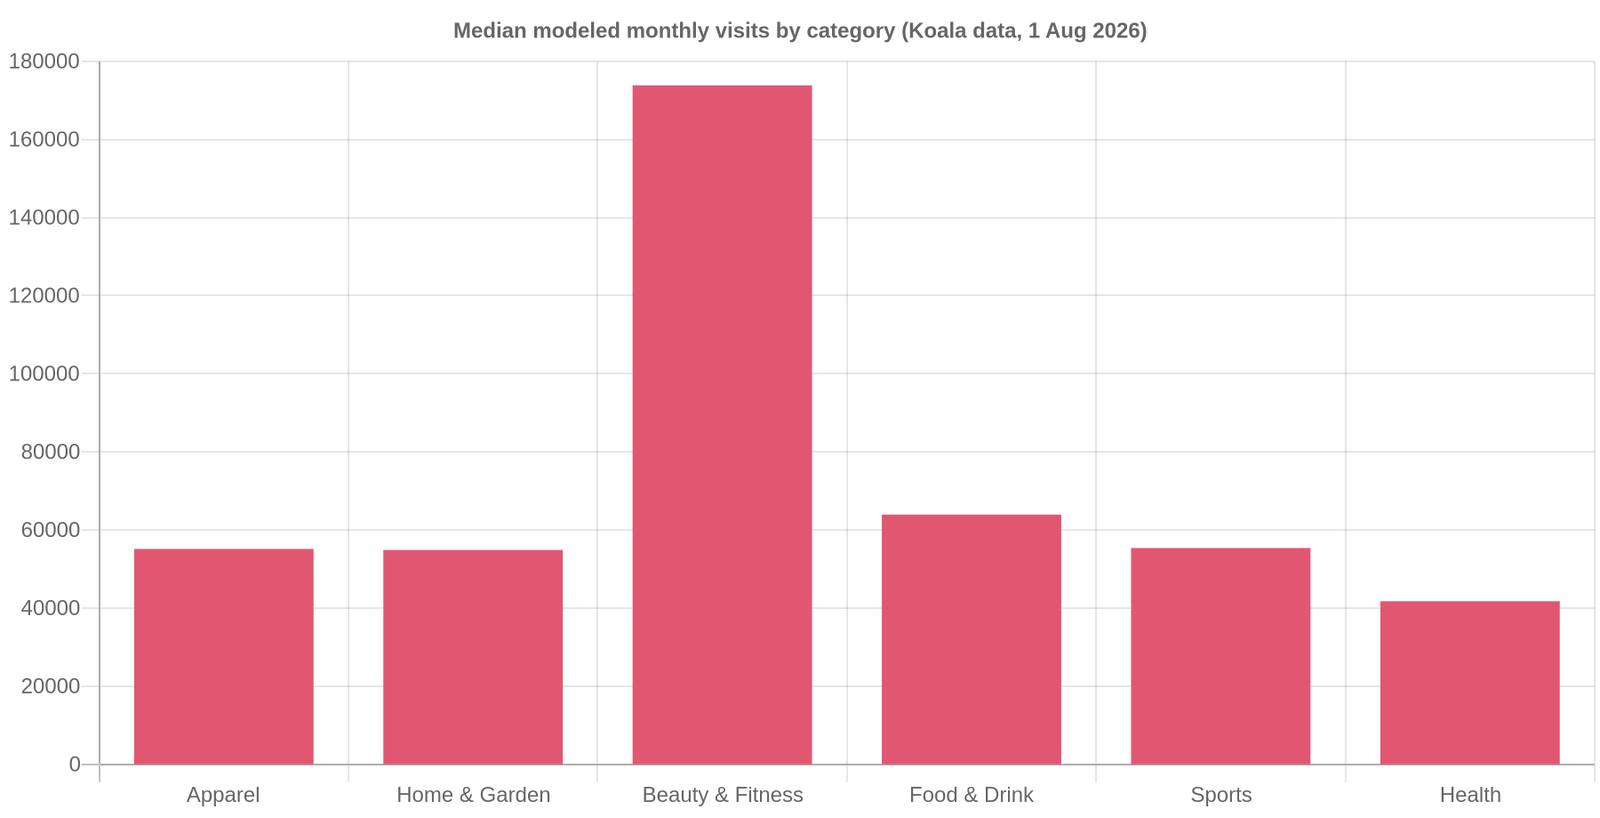
Apparel and home and garden are the two biggest categories in the cohort and they benchmark almost identically, within 500 visits and $5,000 of modeled sales of each other. Beauty and fitness is the outlier: median traffic of 173,820 is 3.2 times apparel's, and median modeled sales of $901,337 is 2.3 times. Sales scale less than traffic there, which is what you would expect from a category selling lower-priced repeat items to a bigger audience.
Health tells the opposite story. It has the lowest median traffic in the table and the highest median app count at 14, with app spend well above the apparel and home and garden figures. Smaller audiences, more machinery per visitor, which fits a category built on subscriptions, compliance and repeat purchase.
The practical use of this table is to stop comparing yourself across categories. A home and garden store doing 55,000 visits is on the median. A beauty store doing 55,000 visits is in the bottom quarter of its own category.
How to read these numbers
A short, honest methodology note, because a benchmark you cannot interrogate is not worth citing.
What the cohort is. The 300 stores in Koala's data with the highest modeled monthly visits, snapshotted on 1 August 2026. It is a sample of active, established Shopify merchants, not a census of Shopify.
Which figures are read and which are modeled. Installed apps, the active theme, the store's category and its product catalogue are read from what each store publishes publicly, so they reflect what the store actually runs. Traffic and sales are estimates. They are built to compare stores and spot trends, and they are directional rather than exact. The full explanation of how sales estimates are built is worth ten minutes before you quote a revenue figure anywhere.
Sales are gross. Every dollar figure in the sales columns is revenue before product cost, shipping, payment fees, ad spend, refunds and overhead. A store on the median here is not taking home $396,317 a month.
App spend counts subscriptions, not usage. The monthly app spend figures cover the recurring cost of the apps a store runs. 233 of the 300 stores had a spend figure in this snapshot; the 67 without one are excluded from the spend statistics rather than counted as zero, which is why the spend percentiles and the app-count percentiles are drawn from slightly different denominators.
Counts move between snapshots. The leaderboards report how many tracked stores run each app or theme on the snapshot date. Those counts shift as the tracked set changes, so cite the date with the number.
Run this read on any single store
Benchmarks tell you where you stand. They do not tell you what the store beating you is doing differently. That is a one-store question, and it takes about a minute to answer.
Koala Inspector is a free Chrome extension. Open any Shopify store and it shows you every app that store has installed, grouped by what each one does, plus the active theme, the full product catalogue with likely best-sellers and prices, the store's category, product count and launch date. All of that is free, with no token cost and no credit card. Traffic breakdowns, ad campaigns and competitor tracking sit behind a token, and the free plan includes 15 tokens a month to try them.
So take any row in the tables above, open the store, and see the stack behind the number.
Benchmark any Shopify store in a minute
Install Koala Inspector free and read the apps, theme, catalogue and best-sellers behind any store you are competing with.
What researchers say about Koala Inspector
Verified reviews from the Chrome Web Store.
“The service has been great, very responsive and the most comprehensive spying of global markets Ive seen!”
 Adrienne Greenwood
“Super simple to use and gives tons of detail of other stores. It helped me learn how to improve my store.”
 Jessica Walker
“Awesome customer support. Insights into store AOV, products, traffic and campaign tracking is extremely helpful!”
 Gabe Abramovich
Shopify benchmark questions people ask
The questions that come up alongside store revenue benchmarks, answered straight.
Can you make 10k a month on Shopify?+
Yes, and by the standard of an established store it is a modest number. The median store in this benchmark sits at roughly $396,317 of modeled monthly sales, so $10,000 a month puts you well below the busy end of the market and firmly inside the range of a store that is working. The harder question is what you keep. One merchant who posted a $10,000 month found close to $900 disappeared into payment processing, the extra Shopify transaction fee, currency conversion and chargebacks before anything else came out. Budget for fees, ad spend and refunds before you call $10,000 a living.
Are Shopify point of sale payments secure?+
Shopify states that it is certified Level 1 PCI DSS compliant and that the compliance extends by default to all stores powered by Shopify, covering the store, its shopping cart and its hosting. Level 1 is the highest of the four PCI merchant levels and involves annual on-site assessment. That covers the payment plumbing. What it does not cover is your own operational security, so staff account permissions, device access in the shop, and who can issue refunds are still on you.
Which paid Shopify theme was actually worth the money for you, and why?+
Our theme data argues for spending nothing until you have a reason to. Dawn and Horizon are both free themes designed by Shopify, and together they account for 1,593 of the stores in this snapshot, second and third on the leaderboard behind Trademark on 1,239. Among the paid themes that do earn their price, Impulse (367 stores), Prestige (326) and Publisher (281) are the ones that show up most in Koala's data, which is a better filter than a demo page because it means real stores kept them. Buy a paid theme once you can name the specific thing your free theme will not do. If you cannot name it, the theme is not what is holding the store back.
How can I get a business license for my online store?+
In the United States, the Small Business Administration says most small businesses need a combination of licenses and permits from both federal and state agencies. Federal licensing applies only to specific regulated activities such as agriculture, aviation, firearms, fishing, broadcasting and nuclear energy. Everything else comes from your state, county or city, and the SBA's advice is to visit your Secretary of State's website to find out which permits and licenses you need. Retail is one of the commonly regulated activities at state and local level, so start there, then check your city.
Is Shopify suitable for beginners?+
Yes. The two themes Shopify designs itself, Dawn and Horizon, are free, and Horizon is built around a clean setup so merchants can launch faster. On the app side, the beginner instinct to install everything is not what busy stores do: the median store in this benchmark runs 11 apps and spends about $51.99 a month on them. Start with a free Shopify theme, add apps only when a specific job needs one, and spend the saved time on products and traffic.
What is not allowed to be sold on Shopify?+
Shopify's Acceptable Use Policy is written as principles rather than a product list. It rules out activity that is illegal, that breaches commerce norms, that promotes violence or that facilitates self-harm, and it names Protected Health Information subject to HIPAA as unsupported on the platform. A second layer matters just as much: Shopify's payments terms state that prohibited and restricted business categories are defined by each payment processor in your country, so your processor's list can stop you selling something the platform itself never named. Check both before you build a store around a category.
Sources referenced in this report
- Shopify, Acceptable Use Policy and Shopify Payments terms, on what may and may not be sold.
- Shopify, PCI compliance, on Level 1 PCI DSS certification.
- Shopify Theme Store listings for Dawn and Horizon, and the theme store index.
- U.S. Small Business Administration, Apply for licenses and permits.
- Merchant reports on app bloat (50-store audit) and on fees against a $10,000 month (r/dropshipping).
Everything else on this page is Koala's own store intelligence, snapshotted 1 August 2026. Cite it with the date attached.
Written by
Assaf Shalin
Co-founder & Developer, Koala Apps
Assaf Shalin is a co-founder of Koala Apps and one of the developers behind Koala Inspector. He builds the tools that let Shopify sellers see what is actually working in other stores, from installed apps and themes to best-selling products. On the blog he covers the technical side of store research: how competitor research really works, what public store signals can and cannot tell you, and how to turn them into decisions.
Connect on LinkedIn