How Shopify Sales and Revenue Estimates Are Calculated (and How to Read the Numbers)
People want one number. Open a competitor's Shopify store, ask "how much does this place make," and the honest answer is a range, not a figure with a dollar sign you can take to the bank. That gap between the number people want and the number the data can support is where most confusion about sales estimates lives. Search for the brand behind any of these tools and Google surfaces the same blunt question people are really asking, is the tool accurate. The useful version of that question is not yes or no. It is: what does the number actually measure, how is it built, and how should you read it.
This guide explains how sales and revenue estimates for a Shopify store are derived, what makes one estimate tighter than another, why gross revenue is not the same as money kept, and how to read the ranges so they help your decisions instead of misleading them.
Table of contents
- How tools estimate Shopify sales
- What makes an estimate tighter or looser
- Gross revenue is not profit
- How to read estimate ranges sensibly
- FAQ
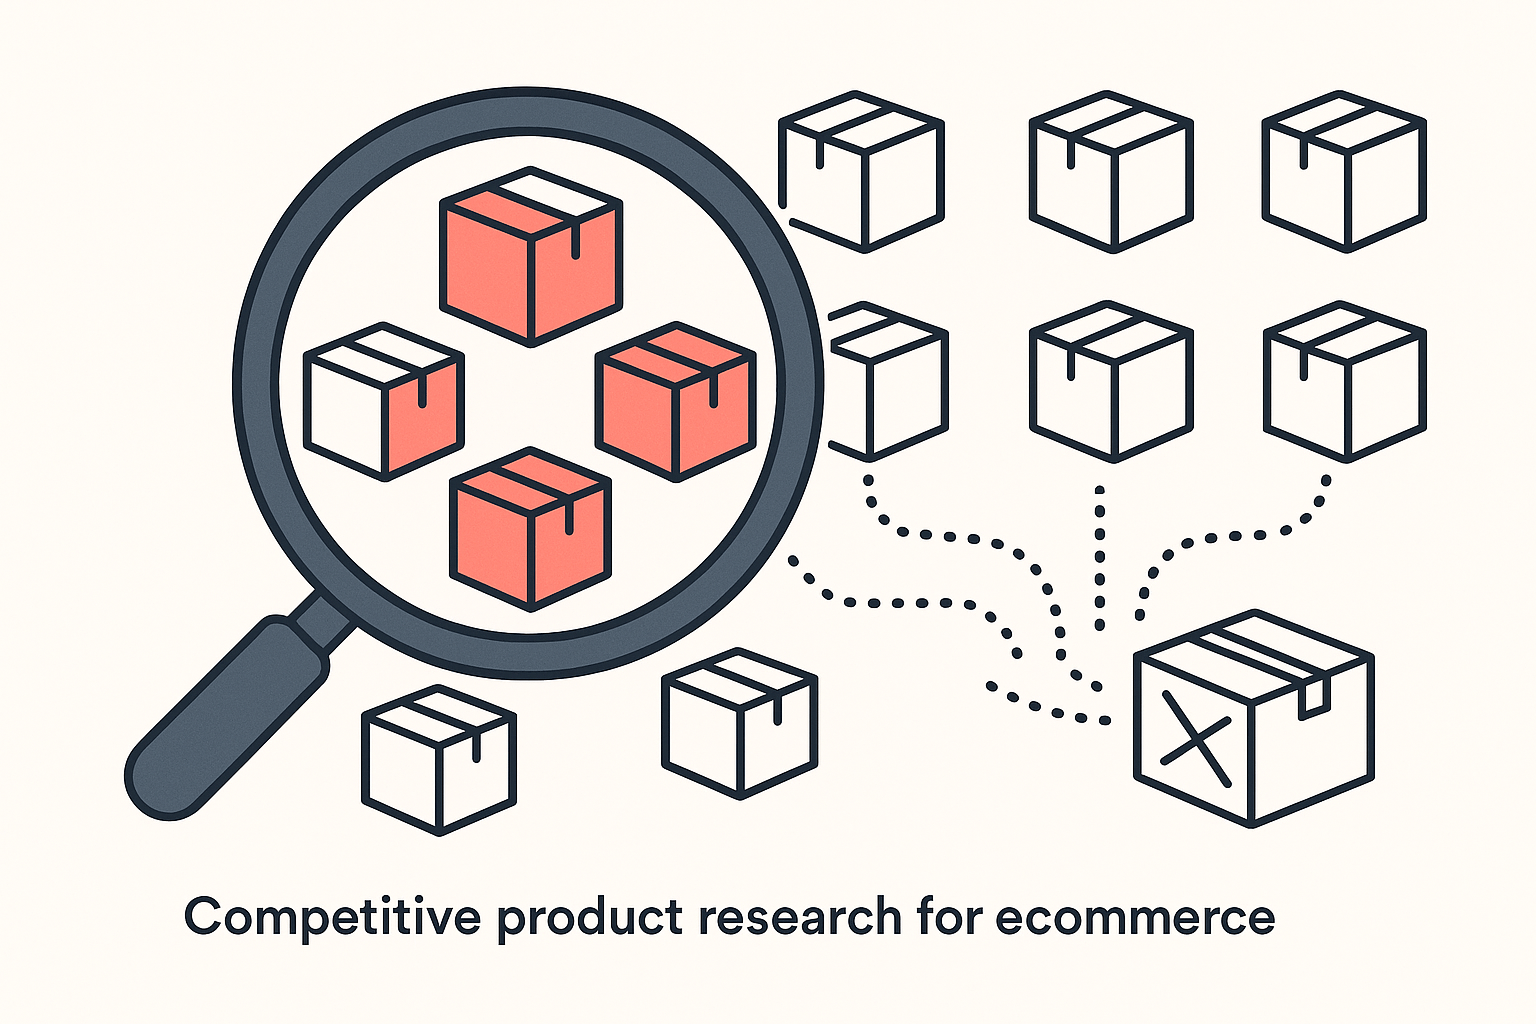
How tools estimate Shopify sales
A Shopify store is more open than it looks. A storefront has to show shoppers enough to sell to them, and that same public-facing information is what an estimation tool reads. It never sees the store's private dashboard. Instead it watches what any visitor's browser can already see, samples it repeatedly over time, and turns the pattern into a sales figure. Three kinds of signal do most of the work.
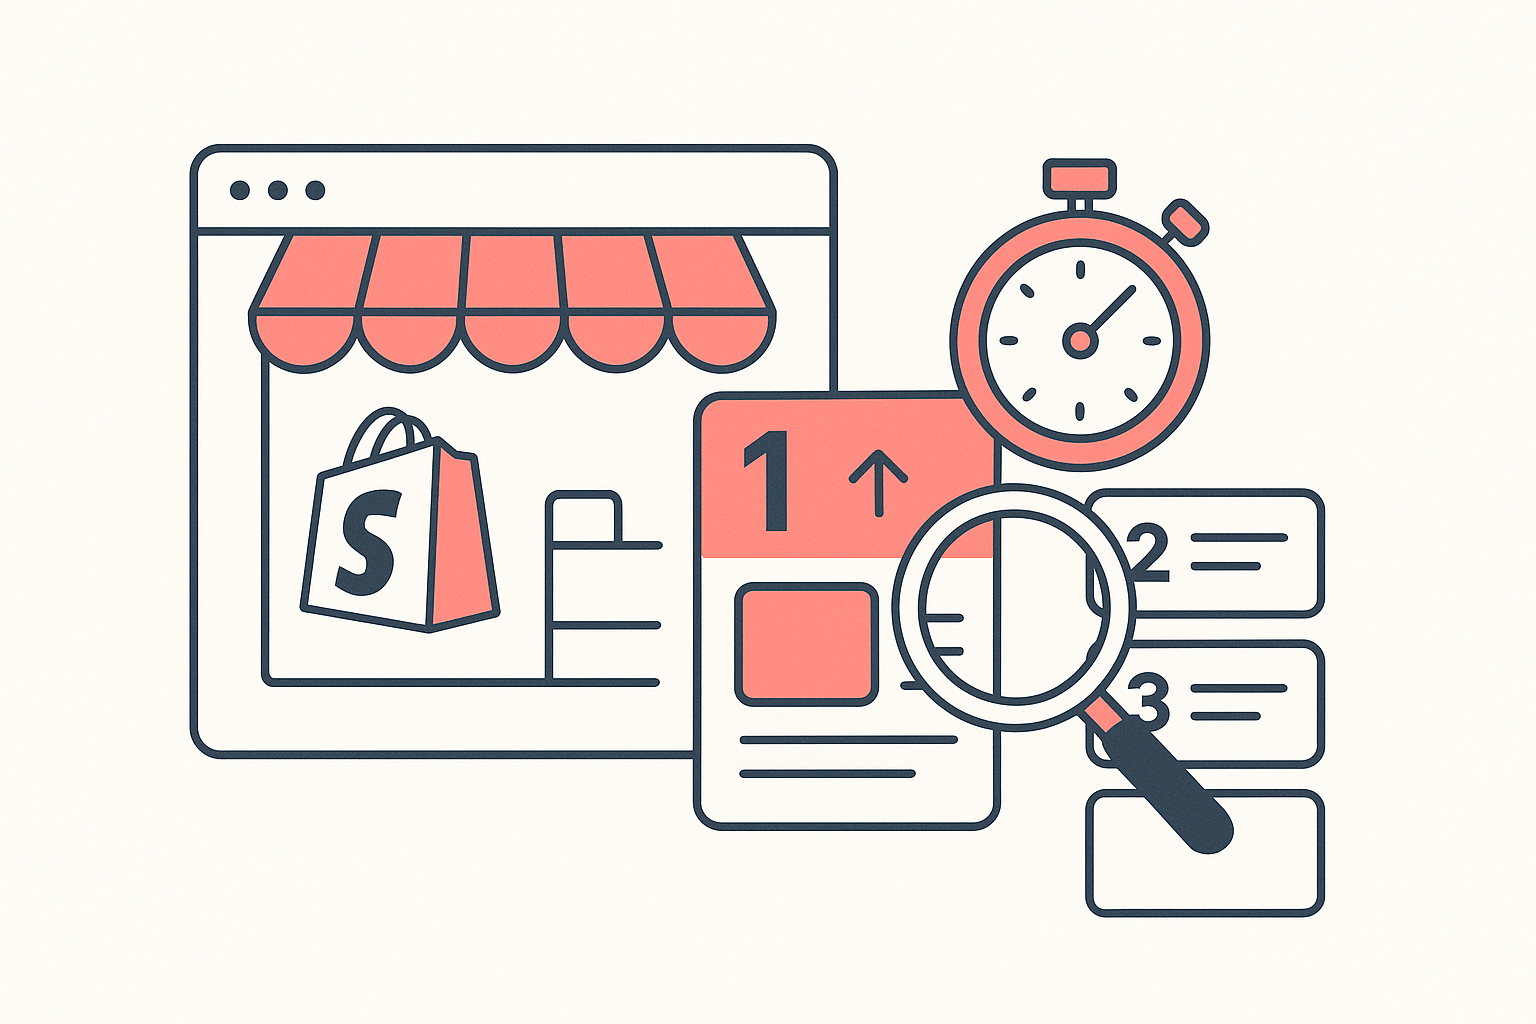
How fast products move. The clearest signal is pace, how quickly a store's products turn over. A tool reads that from public storefront signals and, crucially, samples them again and again across days rather than once. Think of it as standing outside a shop and counting how often the till rings, repeatedly, over a week, rather than reading the shop's accounts. One look tells you almost nothing. Many looks over a longer window give a steady read on the pace of sales.
What the catalog is doing. A store's catalog gives away its health. The size of the range, how often new products show up, and which items the store pushes to the front all carry signal. A store adding products every week and leaning hard on a few winners is behaving differently from one whose catalog has not changed in months. That activity helps a model separate a working store from a dormant one and weight the estimate accordingly.
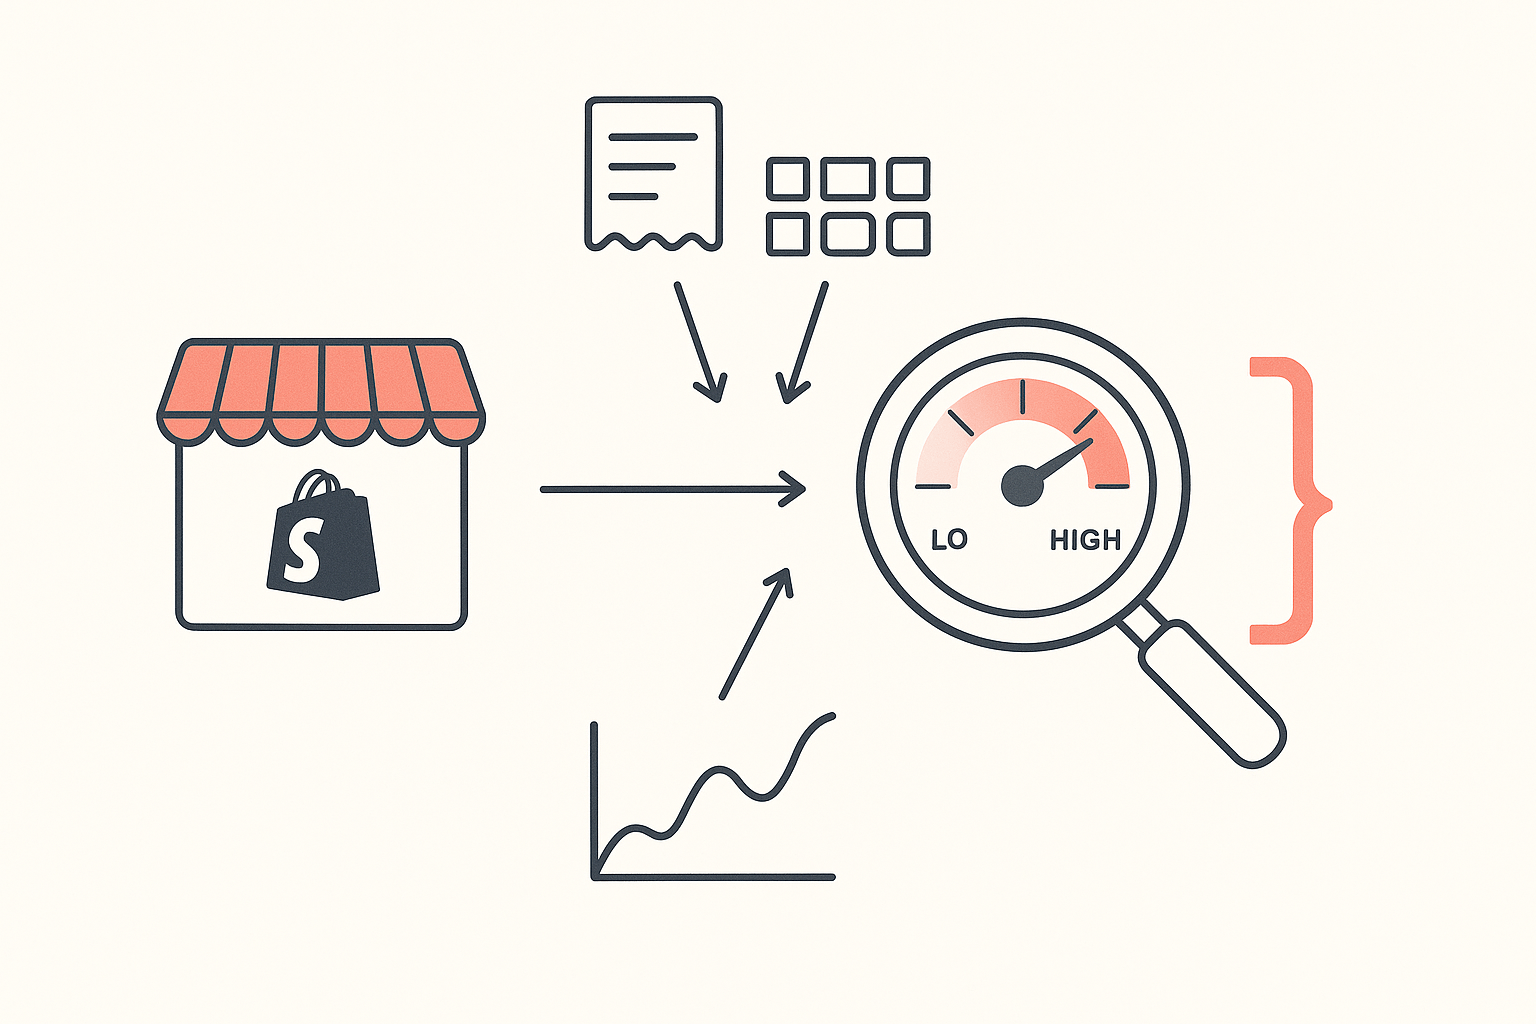
How busy the store is. Sales scale with visitors, so traffic feeds directly into a sales estimate. A busy store with fast-moving products lands at a higher estimate than a quiet store with the same catalog. Combine an estimated order volume with a typical order value for that store, and you arrive at a revenue figure.
None of this touches the store's private analytics. There is no login, no access to the merchant's Shopify dashboard, no insider feed. Everything is modeled from what any visitor's browser can already see, organized and sampled at a scale a person doing it by hand could not match. That is the whole point of the question people ask about accuracy: the number is a careful estimate built from public information, and once you know that, you know exactly how much weight to put on it.
What makes an estimate tighter or looser
Not every estimate deserves the same confidence, and the difference is not random. A few factors decide whether a number is a tight read or a loose one.
- How much public signal the store exposes. A busy store with steady traffic and products visibly turning over gives a model plenty to work with. A store that runs very low traffic or keeps its storefront sparse exposes less, so the estimate widens.
- How often it gets sampled. A single snapshot is a guess. Many samples across days and weeks smooth out the spikes from a sale, a viral post, or a slow Tuesday. The longer the observation window, the more a one-off blip stops distorting the average.
- How typical the store's order value is. Revenue is order volume times average order value. If a store sells one product at one price, that multiplier is easy. If it mixes a five dollar add-on with a two hundred dollar bundle, the average is harder to pin down and the revenue figure carries more uncertainty than the order-count figure.
- The store's size. Larger stores tend to produce steadier, more reliable estimates because they generate more signal. A brand-new store with a thin history is the hardest case, since there is little to sample.
This is why a sensible tool presents a range or a directional figure rather than a single hard number, and why two tools can disagree on the same store. They sample different signals at different moments and apply different assumptions. The overlap between them is the trustworthy zone.
Gross revenue is not profit
Here is the misread that causes the most trouble, and it has nothing to do with how the estimate is built. A revenue estimate measures gross sales, the money flowing in. It says nothing about what the store keeps. People see a healthy revenue number and assume the owner is pocketing it, when the real picture after costs can be close to zero.
Sellers who actually run the numbers draw the same line. An experienced dropshipper who crossed six figures in 2025 counted it as profit, not revenue: the figure that mattered was what was left after ad spend, refunds, and fees, not the gross total. That gap is where product cost, shipping, payment processing, and especially ad spend live, and on thin margins it swallows almost the whole gross number. A store can post revenue that looks like a thriving business while the money it actually keeps says it is running to stand still.
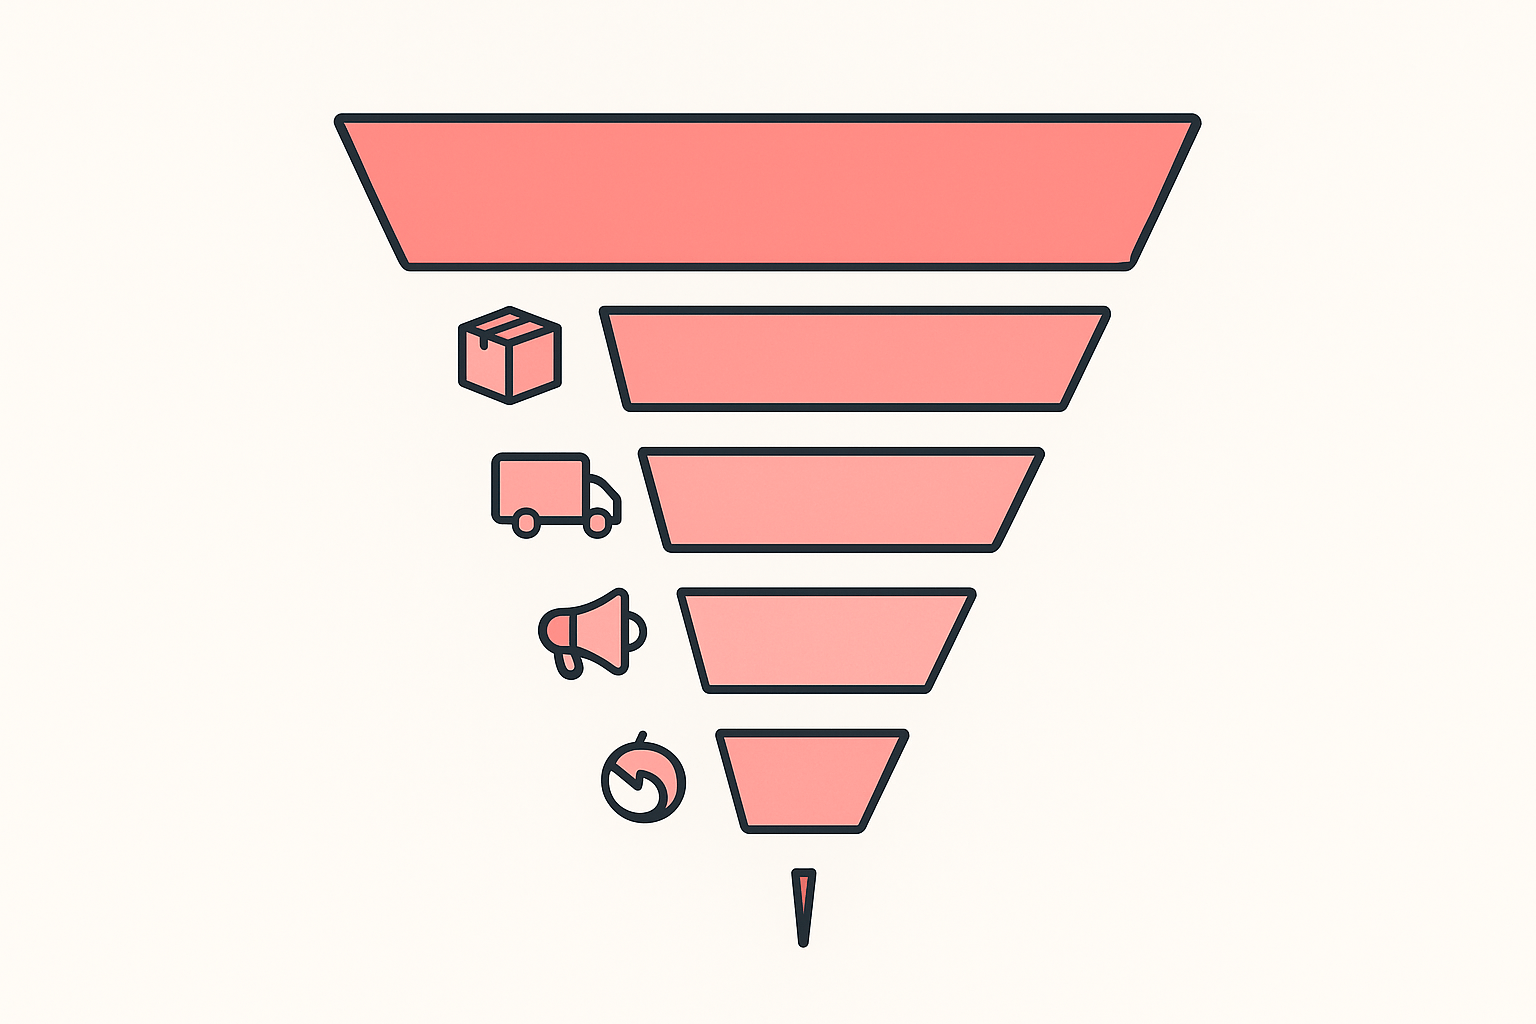
This matters for how you use any estimate. If you are scouting competitors, a high revenue estimate tells you a store is moving volume, not that it is printing money. A store doing real sales on thin or negative margins is a warning, not a target to copy blindly. The estimate is the top of the funnel. What happens below it, the product cost, the fulfillment, the ad efficiency, decides whether there is a business under the revenue.
So when you read an estimated revenue number, hold a second question in mind: at what margin. A store you admire might be selling a high-cost product on paid traffic with little left over. A smaller store on organic traffic and a fat margin could be the healthier business. Revenue is the headline. Margin is the story.
How to read estimate ranges sensibly
Once you accept that the number is a modeled estimate of gross sales, reading it well is straightforward. A few habits keep you on the right side of the data.
- Read the range, not the midpoint. If a tool shows a band, the band is the point. A store estimated at "roughly 200 to 400 orders a month" is telling you it is a mid-volume store, not a precise 300. Treat the width as a confidence signal: a narrow band is a confident read, a wide one says sample with care.
- Compare, do not isolate. Estimates are most reliable as relative measures. Which of two competitors is bigger, which product in a catalog ranks as the best seller, whether a store is growing or fading across checks, these comparative reads hold up far better than any single absolute figure. Use the estimate to rank and prioritize.
- Stack signals. A revenue estimate is one input. Put it next to the store's best-selling products, its newest launches, the apps it runs, and its theme, and the estimate stops being a lone number and becomes part of a picture. A high estimate plus a fast-moving best-seller list plus heavy app investment is a far stronger read than the revenue figure alone.
- Validate before you bet. Use an estimate to build a shortlist, never to commit budget. If a product looks like a winner across several stores you check, that repeated signal is worth acting on. One number from one snapshot is not.
- Watch it over time. A single estimate is a photo. Checking the same store across weeks turns it into a trend, and a trend is far more honest about whether a store is scaling, holding, or sliding. Tracking the change is the real value, which is the idea behind monitoring a store's sales over time rather than reading it once.
The Koala Inspector Chrome extension is built around exactly this read. Open any Shopify store and it surfaces estimated sales and traffic next to the store's best sellers, newest products, theme, and apps, all from public signals, so you get the estimate in context instead of as a number floating on its own. It is free to start, and you can find your first store's best sellers and sales signals in the next few minutes.
Read the estimate for what it is, a careful, public-data model of gross sales, pair it with margin sense and other signals, and it becomes one of the most useful reads you can get on a store you do not own.
FAQ
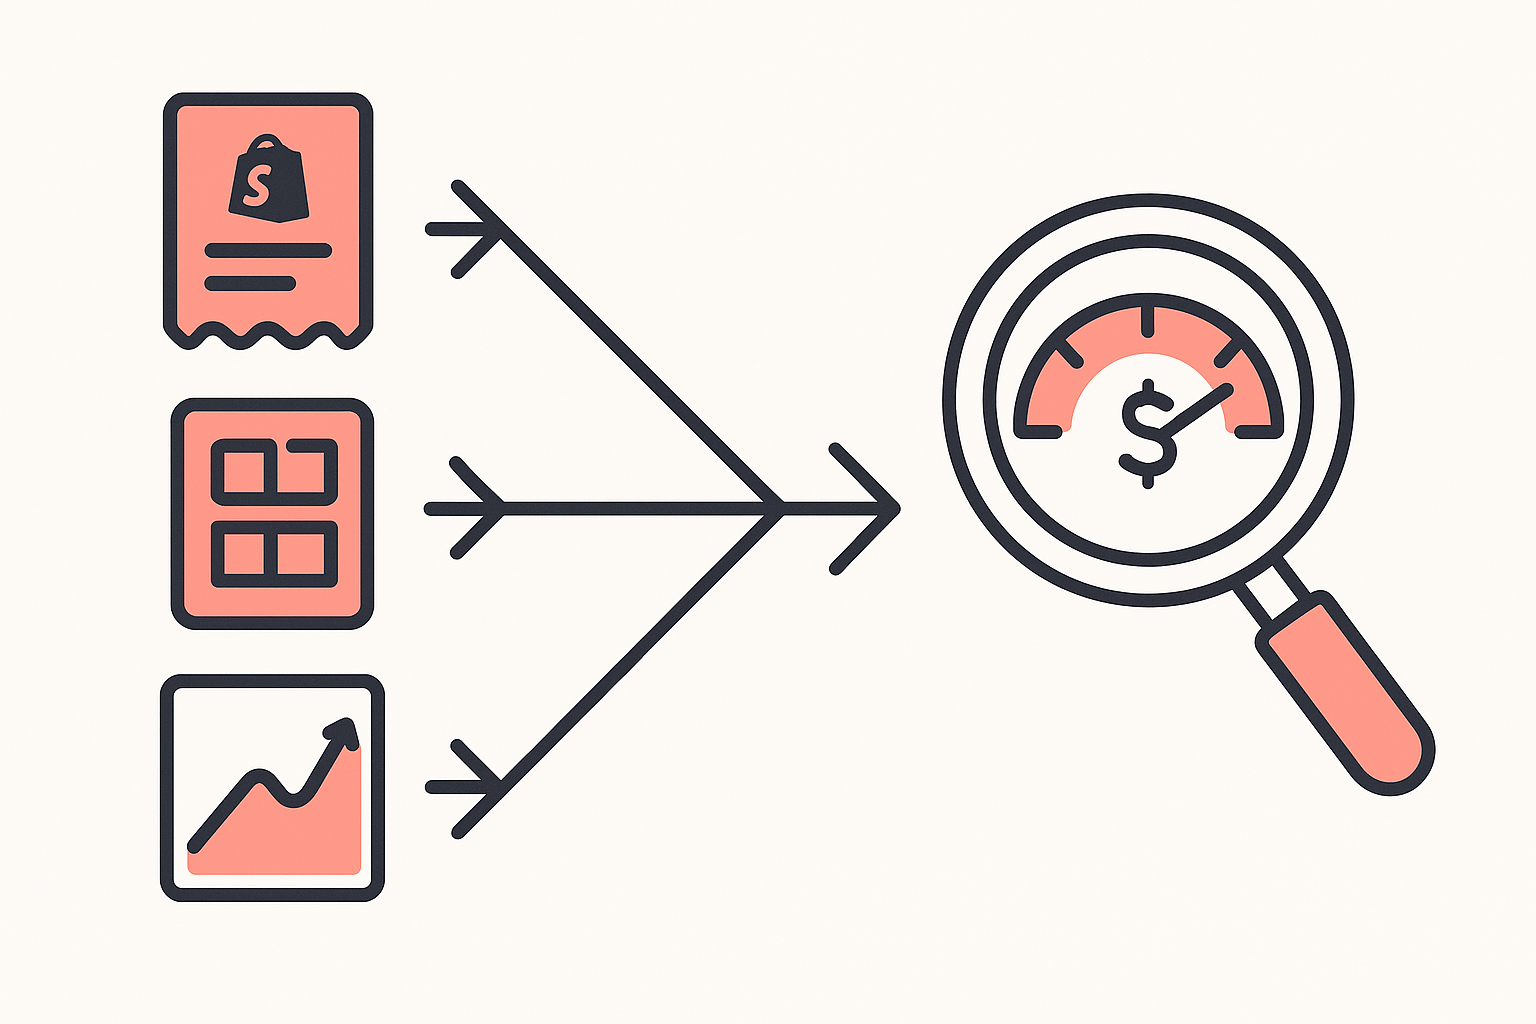
How are Shopify revenue estimates calculated? Tools read a store's public signals: how fast its products move, the size and freshness of its catalog, and traffic indicators. They sample those signals over time to estimate how fast products are selling, then multiply an estimated order volume by a typical order value to produce a revenue figure. The store's private Shopify dashboard is never accessed, so the result is a model built from public information, not a reported number.
How accurate are Shopify sales estimates? They are directional rather than exact. A store that exposes more public signal and gets sampled more often produces a tighter estimate, while a quiet or low-traffic store produces a wider one. The dependable read is the pattern and the relative scale, which products and stores are bigger and whether they are growing, not a single figure down to the dollar. Use the estimate to rank and shortlist, then validate before acting.
Is estimated revenue the same as profit? No. A revenue estimate is gross sales, the money coming in before any costs. Profit is what is left after product cost, shipping, payment fees, ad spend, refunds, and overhead. A store can show a strong gross number and still keep almost nothing after those costs, which is why experienced sellers are careful to separate profit from revenue, so never read a revenue estimate as take-home money.
Why do two tools show different sales numbers for the same store? Each tool samples different public signals at different moments and applies its own model and average order value. Different inputs and different assumptions give different outputs. Treat the overlap between tools as the trustworthy zone and the spread as the built-in uncertainty, instead of expecting one figure to be the final word.
Can a store hide its sales from these tools? Partly. A store can hold back some of what its storefront reveals, which lowers the available data and widens any estimate. It cannot hide completely, because a working storefront has to show visitors enough to shop. Less public signal means a looser estimate, not no estimate.

Written by
Ana Gelevska
eCommerce Content Writer
Ana Gelevska is a content writer with more than five years of experience creating content for eCommerce brands and global clients. She digs into each topic and the people it is for, then turns it into clear, useful articles that Shopify sellers and dropshippers can act on.
Connect on LinkedIn