Best Shopify Analytics Apps in 2026, Ranked by the Stores Running Them
 By Koala TeamNovember 17, 2026
The most-installed analytics app on Shopify is Microsoft Clarity, running on 59,410 stores across the Shopify stores Koala tracks. Triple Whale follows on 27,487, wetracked.io Connect on 16,670, Lucky Orange Heatmaps and Replay on 14,470, Stape Conversion Tracking on 6,351, Elevar Conversion Tracking on 6,184 and Propel Replay, Survey, Heatmap on 4,030, counted on 15 November 2026.
That order is the useful part. Search this category and the top result is the Shopify App Store's own analytics listing page, which puts hundreds of apps behind one label and tells you nothing about which ones merchants actually keep. The ranking below is adoption: how many live stores in Koala's tracked set are running each app right now.

Want to see apps on any Shopify store?
Download for free and start exploring a whole new ecommerce world!

Three different purchases share one word
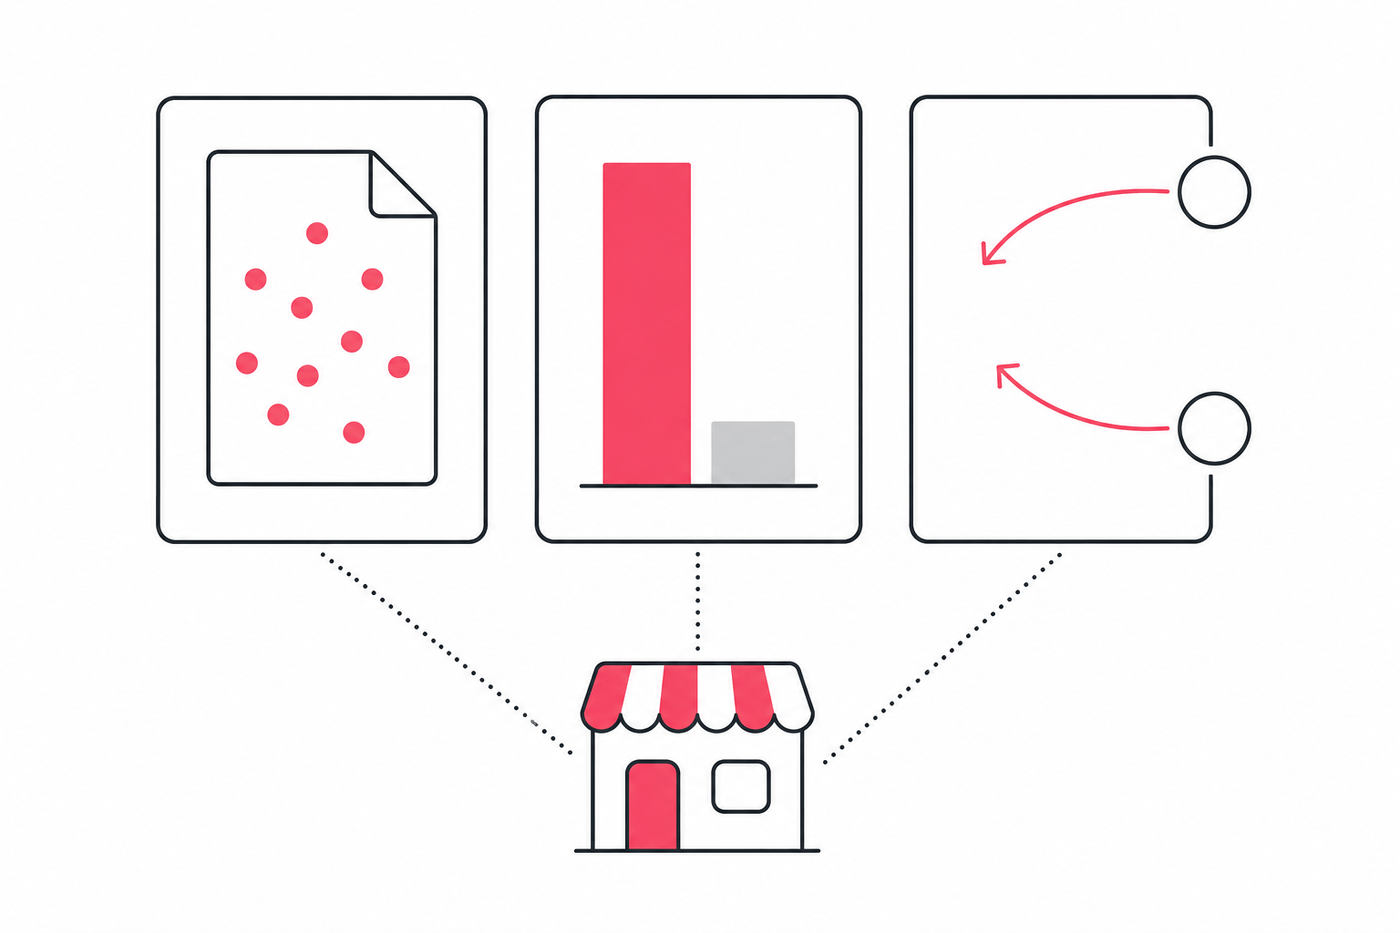
Merchants typing "analytics app" are shopping for one of three things, and the apps that serve them barely overlap:
- Session and behaviour analytics answers why a visitor left. Replays, heatmaps, funnels, surveys. Microsoft Clarity, Lucky Orange and Propel live here.
- Profit and margin analytics answers what you actually made after product cost, shipping, fees, discounts, returns and ad spend. Triple Whale is the only app in this group with real adoption.
- Attribution and conversion tracking answers which ad produced the order, and fixes the data loss that makes ad platforms under-report. wetracked.io Connect, Stape and Elevar are plumbing, not dashboards.
Buy the wrong one and the app works perfectly while answering a question you did not have. A store whose conversion rate is fine but whose bank balance is not needs the second group, and a session recorder will show it a hundred healthy-looking visits.
The install counts, and what they are
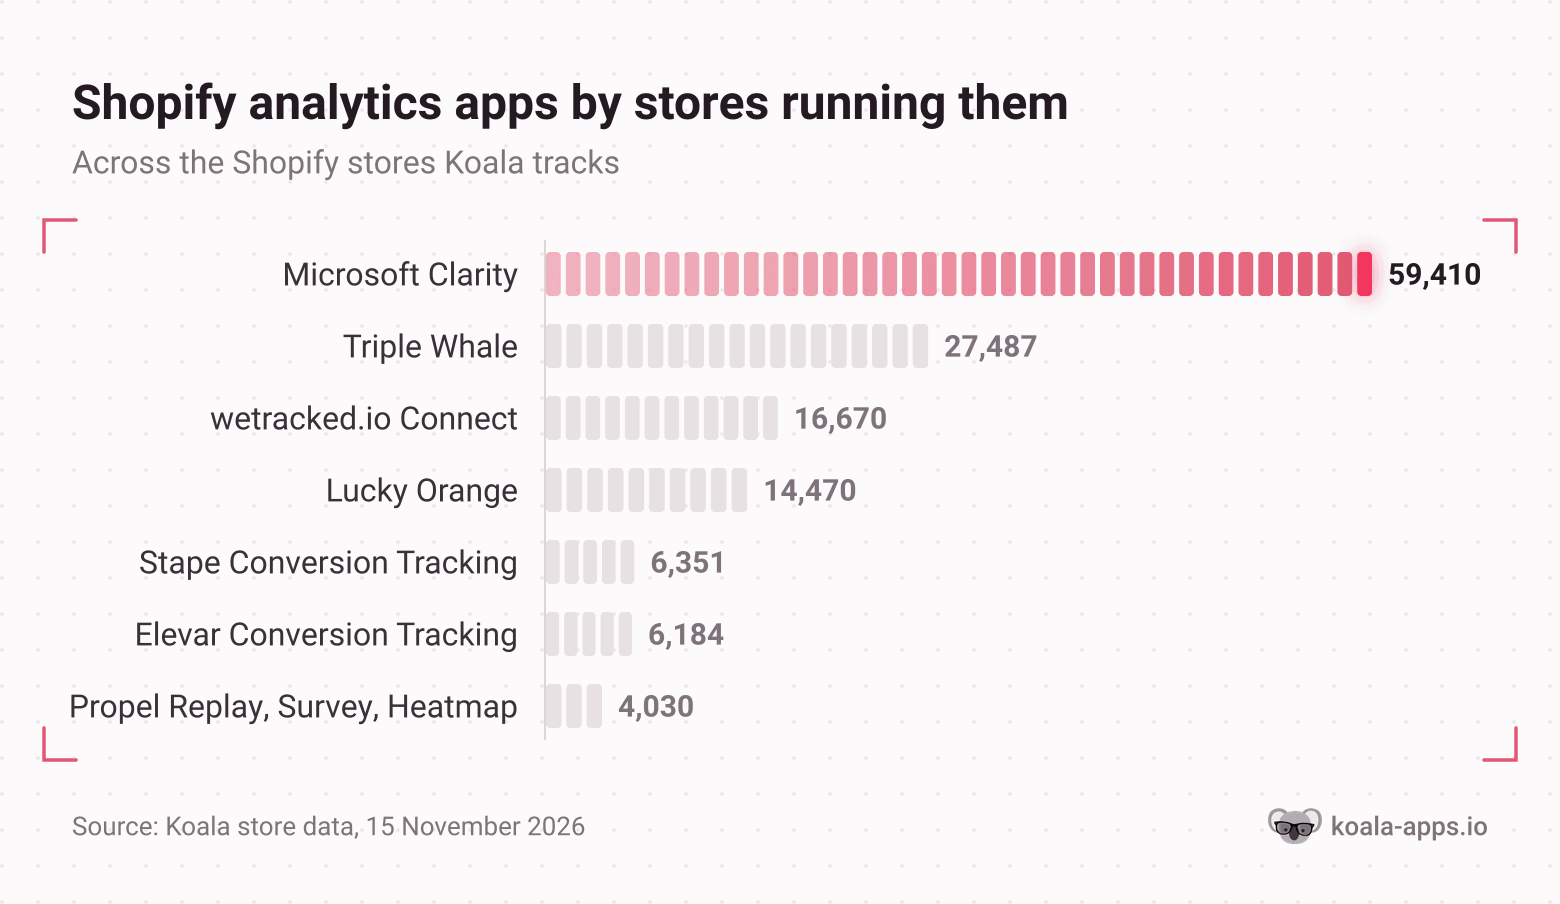
Clarity runs on more than twice the stores of the app in second place, and the gap is widening fast. Across Koala's readings it went from 55,714 stores on 28 October 2026 to 59,410 on 15 November, a gain of 3,696 stores in under three weeks. Triple Whale added 544 over the same stretch. One app is being adopted at roughly seven times the rate of the next.
Price explains most of that. Clarity is free on a single plan with no session cap published on its listing, so installing it is a decision nobody has to justify. Every other app on this page either meters you or sends you to a sales call.
Two caveats before you read anything into the order. These are counts across the Shopify stores Koala tracks, not a census of the platform, and that coverage leans toward the dropshipping and direct-to-consumer stores our users research. And an install count measures adoption, not results. It tells you what merchants in your niche kept installed, which is a far better starting point than a ranked opinion, and it says nothing about whether the app will earn its fee in your store.
One absence says as much as the ranking. No dedicated profit-analytics app appears anywhere in the 250 most-installed apps in Koala's data. Merchants are buying session recorders in their tens of thousands and profit tools barely at all, which lines up exactly with what they post when the numbers stop making sense.
Session and behaviour analytics
Microsoft Clarity: AI Insights, 59,410 stores
What it does. Microsoft Clarity records real sessions and builds heatmaps of clicks and scrolls on your pages, then layers conversion funnels and smart events on top so you can see where shoppers drop out. Its listing also names Brand Agents, AI shopping assistants that engage shoppers during a visit, and it states GDPR and CCPA compliance with built-in consent. Rated 4.6 across 2,548 reviews, developed by Microsoft Clarity.
Who it suits. Every store, because the decision costs nothing. It is the right first analytics install for a merchant who can see a weak conversion rate in the Shopify admin and cannot see the reason.
Pricing. One plan, Free Forever, $0, as of 17 November 2026.
Verdict. Install it today. Free, backed by Microsoft, and the most-adopted analytics app on the platform by a wide margin. There is no argument for paying for session recording until you have outgrown this.
Lucky Orange Heatmaps & Replay, 14,470 stores
What it does. Lucky Orange covers the same ground with sharper commerce wiring: session recordings, heatmaps, conversion funnels, on-site surveys, and cart abandonment plus checkout tracking broken down by product and step. You can also ask Shopify Sidekick a plain-language question and get an answer from your own visitor and sales data. Rated 4.6 across 908 reviews, developer Lucky Orange LLC, based in the United States.
Who it suits. A store losing people inside checkout rather than on product pages. Clarity will show you a session; Lucky Orange will tell you which checkout step and which product.
Pricing. Free plan with 100 sessions a month and 30-day storage. Launch $19 a month (500 sessions), Build $39 a month (3,500 sessions, 60-day storage), Grow $89 a month (10,000 sessions). Discovery AI is a $5 to $20 add-on by tier. Annual billing saves 20%. Prices as of 17 November 2026.
Verdict. Worth $19 a month when checkout is the leak and you want it attributed by step. The free tier's 100 sessions is a demo, not a plan, so budget for Launch at minimum.
Propel Replay, Survey, Heatmap, 4,030 stores
What it does. Propel is the cheapest serious replay tool here and the only one that advertises bot and competitor click detection by IP and traffic source, which matters when you are paying for those clicks. It records live and recorded sessions including abandoned carts, replays abandoned checkouts on Shopify Plus, runs heatmaps and on-site surveys, and summarises replays with AI so you do not watch all of them. Rated 4.9 across 737 reviews, the highest rating in this roundup, developer Propel Commerce. Its listing claims 8,000-plus Shopify stores.
Who it suits. A store running paid traffic on a small budget that wants to see the sessions those ads bought and spot the ones that were never human.
Pricing. Free Sampler at 750 pageviews a month with 5 AI replay summaries and unlimited heatmaps. Basic $9.90 a month (20,000 pageviews), Plus $19.90 (40,000), Premium $39.90 (80,000); Shopify Plus enterprise plans with checkout recording start at $59.90. The AI Assistant is a $5 to $15 add-on. 7-day free trial on paid tiers. Prices as of 17 November 2026.
Verdict. The best value per pageview on this page. Pick it over Lucky Orange if volume is your constraint and over Clarity if you want the bot-click view, which Clarity does not offer.
Profit and margin analytics
Triple Whale, 27,487 stores
What it does. Triple Whale pulls paid, owned, subscription and organic performance into one view, with its own Triple Pixel for cross-device and cross-platform tracking, multi-touch attribution, custom dashboards and a SQL editor, and Moby, an AI analyst you ask questions in plain language. Higher tiers add marketing mix modelling and incrementality testing. Triple Whale's site states it is trusted by 65,000-plus brands globally.
Read this before you install it. The Shopify App Store listing says the app is not currently available on the Shopify App Store and points support questions to Triple Whale directly, checked on 17 November 2026. The 27,487 stores are real and those installs are in place, and you cannot add it from the App Store today. Signing up runs through Triple Whale's own site instead.
Who it suits. A store spending enough on ads that a day's wrong budget decision costs more than the subscription. Below roughly $10,000 a month in ad spend, a spreadsheet and the method further down this page do the same job.
Pricing. A free tier exists and Triple Whale describes it as completely free of charge, covering the unified view, AI search visibility and Triple Pixel tracking with first and last click attribution. Foundation and Automate are quote-only ("book a walkthrough") and Enterprise is contact sales, as of 17 November 2026. No paid price is published.
Verdict. The most-installed profit and attribution platform, and the hardest to buy. Start on the free tier, prove it tells you something your Shopify reports do not, and treat the unpublished paid pricing as a signal about who the paid product is built for.
What is missing from this category
A dedicated profit tracker, of the kind merchants ask for by name, does not appear in the 250 most-installed apps in Koala's data at all. There is no store-count figure to report because there is nothing to report it for.
That is the single most useful finding on this page. The gap between what merchants say they need and what they install is enormous, and it is why the next section is a method rather than another app.
Attribution and conversion tracking
These three apps produce no dashboard you will look at. They repair the data that ad platforms and your reports are built on, which makes everything above them either true or fiction.
wetracked.io Connect, 16,670 stores
What it does. wetracked.io Connect is a connector and nothing more. Its listing is explicit that it does not modify storefront content and that its only function is to authenticate your store and maintain a reliable data link for tracking to the wetracked.io platform, where the actual ad tracking lives. Rated 4.8 across 177 reviews. A merchant review from 4 November 2026 on the listing reports that attributed conversions came much closer to Shopify's real order count than with pixel-only tracking.
Who it suits. A store running Meta ads whose reported conversions are visibly short of the orders in the Shopify admin.
Pricing. The Shopify app is free to install. The listing states that external charges for using the wetracked.io platform may be billed by wetracked.io directly, so the app price is not the product price. As of 17 November 2026.
Verdict. The most-installed attribution fix in this set by a factor of two and a half. Read the platform's pricing before you count this as free.
Stape Conversion Tracking, 6,351 stores
What it does. Stape installs Google Tag Manager natively, injects the container in one click, generates the major data layer events for you, and sends purchase and refund webhooks to a server-side GTM container. It extends cookies and keeps tracking working where ad blockers break it. Rated 4.2 across 44 reviews, the lowest rating on this page.
Who it suits. Stores already committed to Google Tag Manager and comfortable with server-side tagging, usually with a developer or an agency involved.
Pricing. The app is free. Stape's platform is the bill: Free at $0 for up to 10,000 requests a month, Pro $20 a month ($17 billed annually) to 500,000 requests, Business $100 a month ($83 annually) to 5 million, Enterprise $200 a month ($167 annually) to 20 million. As of 17 November 2026.
Verdict. Capable, with one warning attached: estimate your request volume carefully. The listing's top negative review, posted 15 October 2026, is about exactly that: a merchant sized their plan from their GA4 event count as the pricing page suggested, then found Stape counting around eight times as many events. Use Stape's own advanced calculator rather than a GA4 figure.
Elevar Conversion Tracking, 6,184 stores
What it does. Elevar adds server-side tracking and session enrichment, recovers activity lost to ad blockers and browser restrictions, recognises returning shoppers, and pushes cleaner conversion signals to Meta, Google Ads, Klaviyo, GA4 and 50-plus destinations, with channel accuracy reporting and alerts. Rated 4.7 across 171 reviews, developer Elevar, LLC. Its higher tiers list profit optimization and predicted lifetime value.
Who it suits. A store past a few thousand orders a month where a percentage point of match quality is worth real money, and that has someone to own the setup.
Pricing. Elevar Base is free to install and includes 100 orders a month at $0.75 per extra order, capped at 2 destinations. Elevar Core $225 a month (2,000 orders, $0.50 per extra), Advanced $650 a month (10,000 orders, $0.15 per extra), Premium $1,250 a month (30,000 orders, $0.10 per extra). 15-day free trial on paid plans. As of 17 November 2026.
Verdict. The most complete of the three and the most expensive by an order of magnitude. At $225 a month you need the orders to justify it, which is precisely why its free Base tier caps at 100.
The comparison table
Install counts are Koala's own, read on 15 November 2026. Prices, ratings and review counts come from each app's Shopify App Store listing and the vendor's own pricing page, read on 17 November 2026, and every app is linked so you can check it yourself before you subscribe.
| App | What it answers | Stores in Koala's tracked set | Free tier | Cheapest paid plan | Rating |
|---|---|---|---|---|---|
| Microsoft Clarity: AI Insights | Why a visitor left | 59,410 | Free Forever, the only plan | None, it is free | 4.6 (2,548) |
| Triple Whale | What you made, by channel | 27,487 | Yes, free of charge | Quote only, listing withdrawn | Not shown on listing |
| wetracked.io Connect | Which ad produced the order | 16,670 | App free to install | Billed by wetracked.io | 4.8 (177) |
| Lucky Orange Heatmaps & Replay | Where checkout breaks | 14,470 | 100 sessions/month | $19/month (Launch) | 4.6 (908) |
| Stape Conversion Tracking | Server-side GTM tracking | 6,351 | 10,000 requests/month | $20/month (Pro) | 4.2 (44) |
| Elevar Conversion Tracking | Conversion data you lost | 6,184 | 100 orders/month | $225/month (Core) | 4.7 (171) |
| Propel Replay, Survey, Heatmap | Why a visitor left, cheaply | 4,030 | 750 pageviews/month | $9.90/month (Basic) | 4.9 (737) |
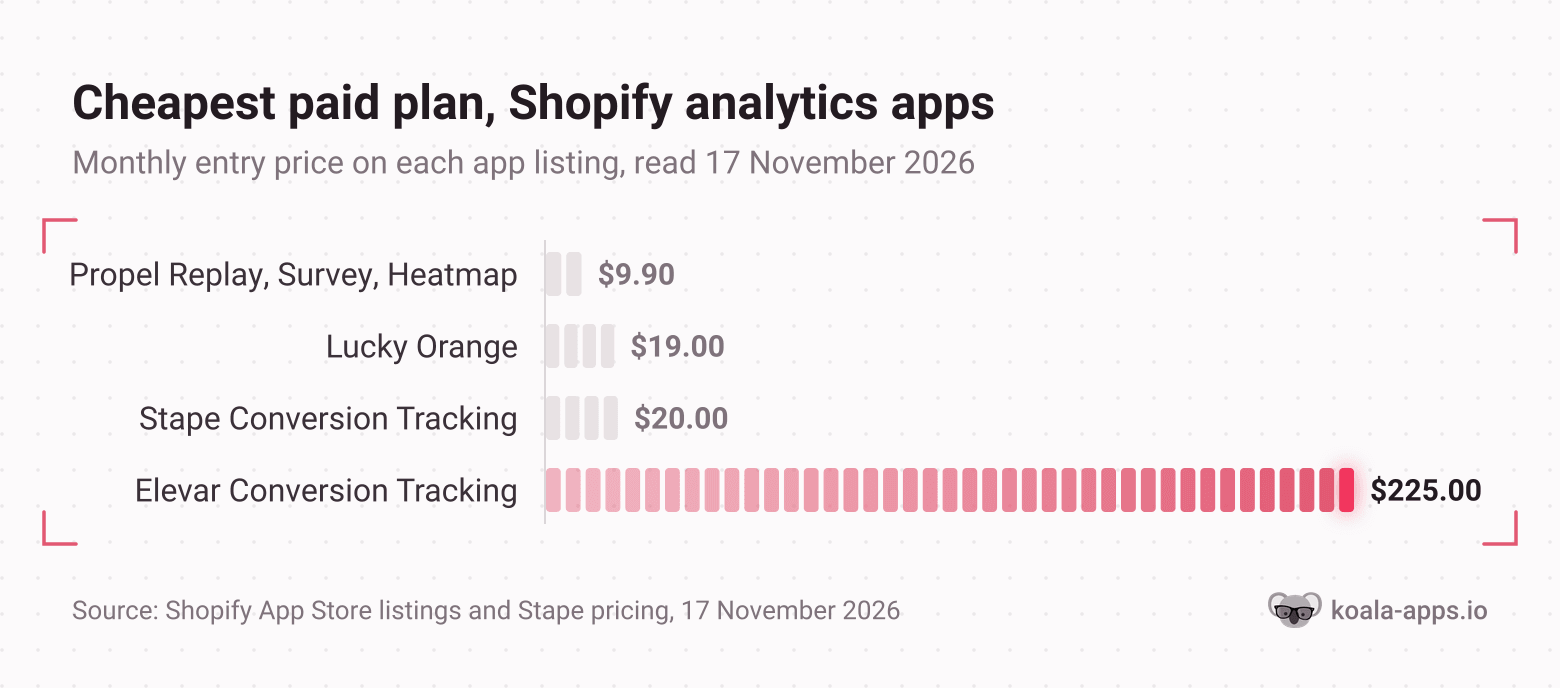
Those four bars are the buying decision. Behaviour analytics is a commodity priced between nothing and forty dollars. Attribution plumbing is where the money goes, and Elevar's $225 entry is roughly eight times Shopify's own Basic plan at $29 a month and nearly three times Grow at $79. An analytics stack can quietly cost more than the platform it reports on, which is the sum our guide to what Shopify apps cost runs properly.
Your own numbers mean nothing without a benchmark
This is the part the other roundups skip, and it is the reason most analytics installs change nothing.
Every app above gives you your numbers. A 1.4% conversion rate. 8,000 sessions. An average order value of $42. None of those is good or bad on its own. A 1.4% conversion rate is a crisis for a store selling $25 impulse products and respectable for one selling $400 furniture. You cannot act on a number until you know what the number should be, and no tool that only reads your own store can tell you.
So set the comparison first, from stores that look like yours.
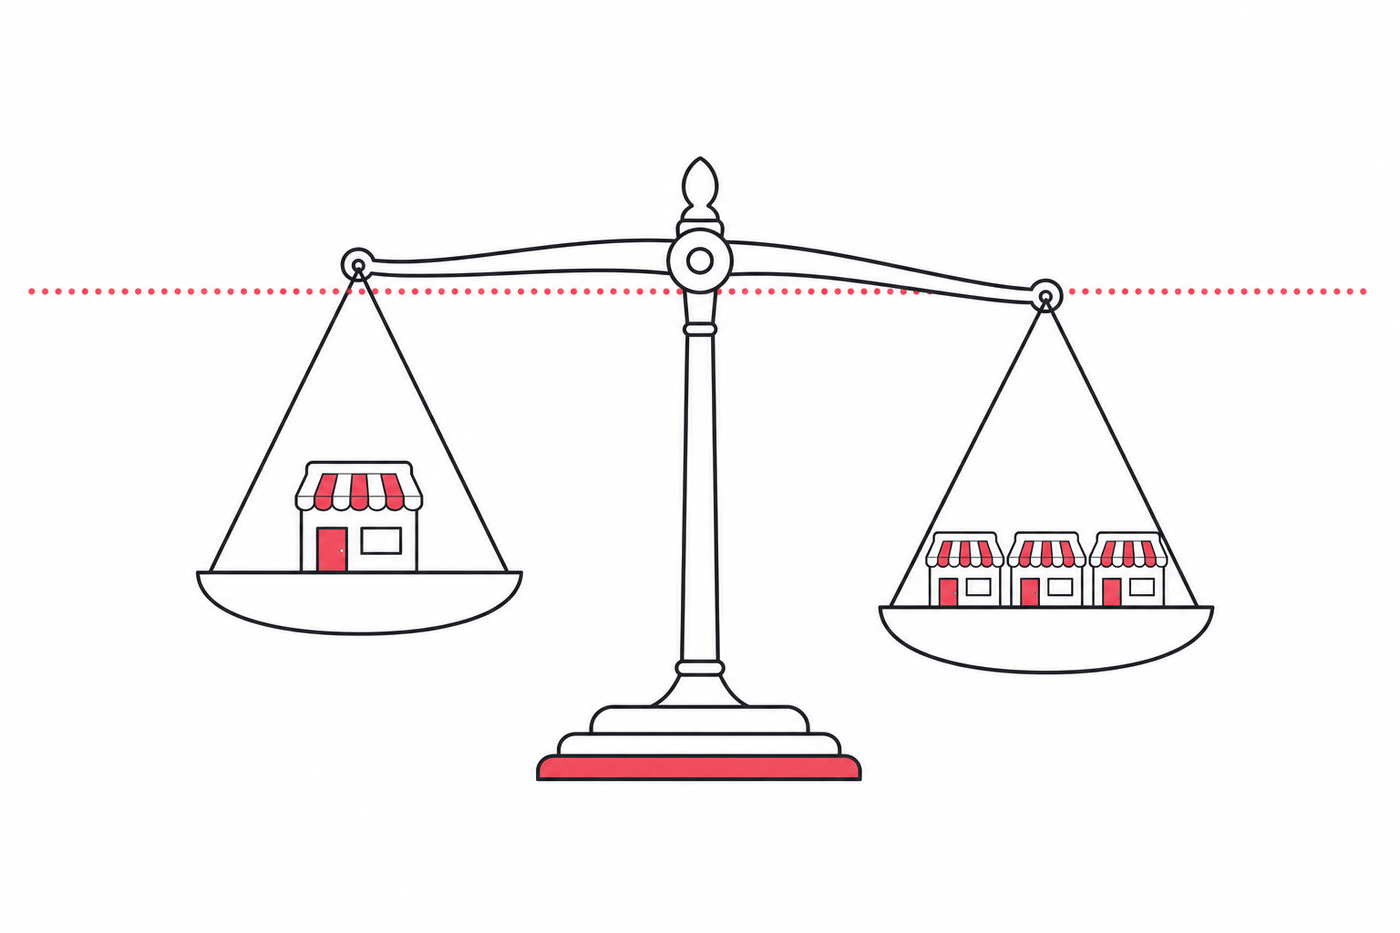
Pick three comparable stores. Not the giants in your category. Search your main keyword and take the stores ranking above you, or the ones whose ads you keep seeing. Comparable means a similar price band, a similar catalogue size and a similar niche.
Read their traffic shape, not just their size. Koala Inspector is a free Chrome extension, and its Site Traffic view gives you a competitor's average monthly traffic over the last three months with the month-over-month change, their bounce rate, average visit duration and pages per visit, how their traffic splits between direct, search, referral and social, the top keywords bringing it in, and which countries it comes from. Everything there is modeled from public signals any visitor's browser can already see, so read it as a well-informed estimate rather than their private dashboard.
Now the numbers in your own analytics have a scale. Three examples of what that changes:
- Pages per visit and visit duration are the benchmark your session recordings need. If comparable stores hold visitors for twice as long on half the pages, your navigation is the problem and the replays will show you where.
- Traffic source mix tells you whether your conversion rate is a site problem or a traffic problem. A store converting at 1.4% on 70% paid traffic and one converting at 1.4% on 70% organic are not in the same position, and only one of them has a margin problem.
- Catalogue and price band set the floor for average order value. Koala Inspector's free store analysis shows any store's product count, category and currency, and its best-sellers view shows which products are carrying the catalogue, with no tokens spent.
Then shortlist the apps. The free Shopify app detector lists every app on any live Shopify storefront, grouped by type, with a link out to each App Store listing. If all three of your comparable stores run a session recorder, that is table stakes in your niche. If none of them run anything in the attribution group, you are about to pay $225 a month for an advantage nobody in your category has bothered with.
Run that pass across three stores and the shortlist writes itself. Install Koala Inspector free and set your benchmark before your next subscription.
How to actually track product profitability
The real question merchants ask about analytics is not which app to buy. Posted to r/smallbusiness in October 2026, it reads: everything on the surface is okay as far as product performance, ROAS and revenue go, but what happens when you account for product costs, shipping, payment processing fees, discounts, returns and advertising spend? The same thread asks whether to measure per product or per store, and how to work out a break-even ROAS.
Merchants keep asking this in different words. One post titled "75 orders, $3.8K sales, but... $750 profit" is the whole problem in a headline. Another asks directly whether revenue is growing while actual profit is not. A third, on managing store finances, asks how anyone tracks actual profit after fees, refunds, shipping and product costs.
Here is a method that works on any plan, with one app or none.
1. Put a cost on every variant, in Shopify. The admin's cost per item field is what powers its profit reports. Shopify documents the catch plainly: profit is reported only for products and variants that had a cost recorded at the time they were sold. Shopify reads a blank cost field as an omission and drops that product out of the report entirely. Go and fill them in before you buy anything.
2. Know what Shopify's profit reports do not include. Gross profit by product is net sales minus the cost of units sold. Shopify's own documentation describes cost per item as static, so a supplier price increase is not applied to past orders, and the market and order reports cover product, shipping, duty and import costs. Payment processing fees and advertising spend are not in there. Those two are usually the difference between a profitable product and a loss, which is why a store can read a healthy margin report and still lose money.
3. Do the per-product sum monthly, in four lines. Per product, for the month: revenue, minus product cost, minus the shipping you actually paid, minus payment processing (Shopify publishes card rates from 2.9% plus 30 cents on Basic and 2.7% plus 30 cents on Grow), minus discounts and refunds, minus the ad spend attributable to it. The last line is the one people skip because it is awkward, and it is the one that decides the answer. If you cannot attribute ad spend to a product, split it by that product's share of revenue. An imperfect split beats leaving it out. Our profit margin calculator runs the arithmetic.
4. Turn the answer into a break-even ROAS and bid to it. Divide revenue per order by the contribution margin per order. If a $42 order leaves $14 after everything but ads, your break-even ROAS is 3.0. Below that, every additional sale costs you money. That single number is what the whole analytics stack is for, and our break-even ROAS calculator gets you there in a minute.
5. Only then buy an app, for the step that hurt. Filling costs took an hour, so you need no app. Attributing ad spend was impossible, so you need the attribution group. You cannot see why orders are not happening at all, so you need a session recorder, and Clarity is free.
A store that has done this once reads every number differently. Revenue stops being the headline, and the question changes from "is this app good" to "which line in my own four-line sum is the bad one".
How we counted
- Install counts: the number of Shopify stores in Koala's tracked set observed running each app, read on 15 November 2026. This is Koala's own store coverage, weighted toward the dropshipping and direct-to-consumer stores our users research, so read it as a strong sample of working merchants rather than a Shopify-wide census.
- Which apps qualify: the analytics, session-recording and conversion-tracking apps that appear in Koala's 250 most-installed Shopify apps. An app below that line is not on this page, which is why there is no dedicated profit tracker here. Order-tracking apps were excluded even though their names carry the word "tracking", because they answer a shipping question rather than an analytics one.
- Clarity's growth figure: Koala's readings of the same app on 28 October 2026 and 15 November 2026, 55,714 and 59,410 stores.
- Prices, ratings and review counts: taken from each app's Shopify App Store listing on 17 November 2026, plus Stape's and Triple Whale's own pricing pages where the App Store listing carries no plan card. Every price is linked.
- Triple Whale: counted because the installs are real and currently in place, and marked as listing-withdrawn on every App Store column because the listing states the app is not currently available there.
- Rankings: by install count only. No app paid for a position on this page.
What merchants say about Koala Inspector
Verified reviews from the Chrome Web Store.
“I was a bit skeptical about all the hype but gave Koala Inspector a shot. It's user-friendly and provides useful data on what's working for others. The support team is also there when you need them.”
 Martin René
“Great tool for competitor research and customer support is really quick!”
 Aiswarya S
“great app for ecommerce, there are a lot of useful information. Friendly customer service!”
 Lavender Yuzu
Sources for the answers below: each app's Shopify App Store listing (linked throughout), Shopify's profit reports documentation, Shopify's pricing page, Stape's pricing and Triple Whale's pricing.
Shopify analytics apps: frequently asked questions
What are the top 5 Shopify analytics tools?+
What is the best tracking app for Shopify?+
Does Shopify have built-in analytics?+
What are the most useful Shopify apps?+
Keep going
- Best Shopify apps is the full category index, every roundup ranked the same way.
- How much Shopify apps cost prices a whole stack, which is the number this page's $225 tier belongs in.
- How to check a Shopify store's revenue is the benchmark question answered from the other side.
- Top Shopify apps is the live leaderboard these counts come from, updated weekly.
- Shopify app detector checks any storefront's full app list free.
Written by
Koala Team
Koala Apps Editorial Team
The Koala Team is the crew behind Koala Inspector. We test tools, track what is selling across Shopify, and turn it into practical roundups and reference guides for store owners and dropshippers.