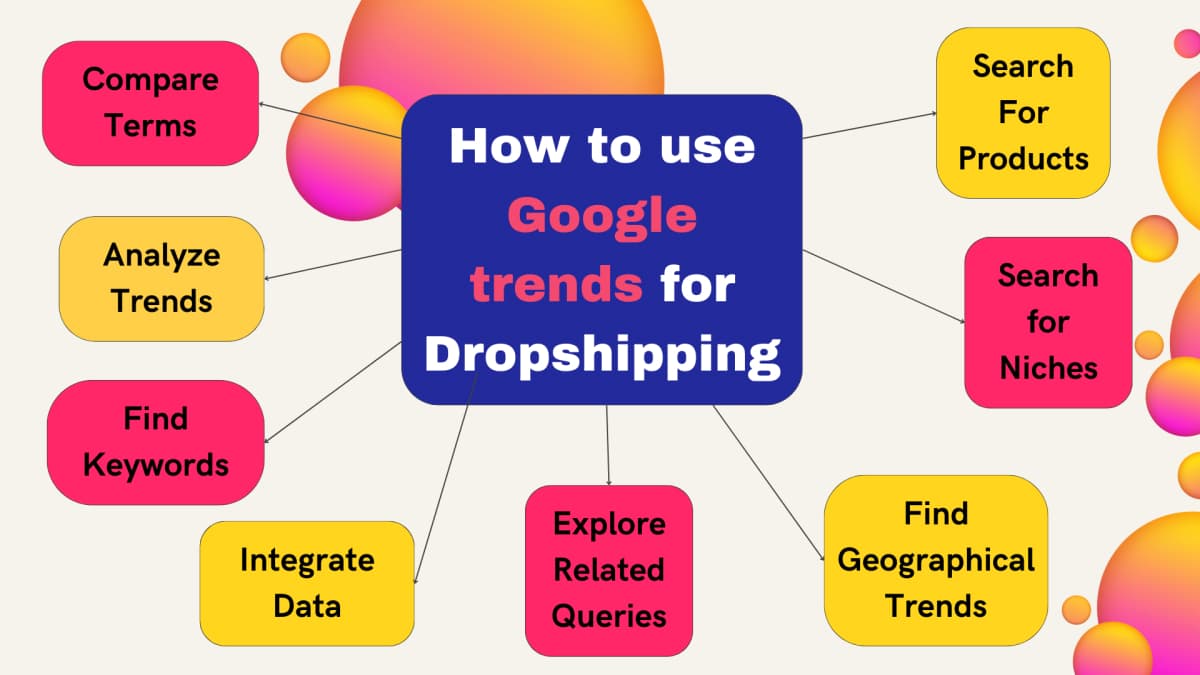
How To Use Google Trends For Dropshipping: Expert & Advanced Tips
Finding profitable dropshipping products is hard partly because the timing is unforgiving. Niches can go from undiscovered to oversaturated in as little as six to eight weeks, so by the time most sellers notice a product gaining traction, the margin has already shrunk. Google Trends won't solve the whole puzzle, but it gives you a real signal that other tools don't: a picture of how search interest for a product is moving, not just where it sits today.
It's also free. For new stores running on thin margins, that matters.
This guide walks through how Google Trends actually works, which features are relevant for product research, and how to apply them in practice across your whole workflow from niche selection to keyword optimization.
What Is Google Trends?
Google Trends indexes search interest over time and lets you compare terms, regions, and categories in a single interface. The data is normalized on a 0-100 scale, where 100 represents peak search interest for a given term in the selected time window. This means you cannot use Trends numbers as absolute search volume counts, but you can use them to compare relative interest between products or track whether interest is growing, declining, or seasonal.
For dropshippers, the most useful read from Trends is directional: is interest in this product increasing right now, and where in the world is that interest concentrated?
Google Trends Features Worth Knowing
Not every feature in Google Trends is equally useful for product research. Here are the ones that actually show up in a real workflow:
-
Interest over time: The main time-series graph. Set your window carefully. A 12-month view reveals seasonality patterns; a 5-year view shows whether a product is a durable niche or a fading trend. A product with consistently rising 5-year interest is a different risk profile than one that spiked and dropped.
-
Interest by region: Shows where search interest is highest, broken down by country, state, or city depending on the geography level you select. Useful for deciding which ad markets to test first or which product variants to stock.
-
Related queries: This is the most underused feature. The "Rising" filter shows terms whose search interest has jumped significantly compared to the prior period. Those rising related queries are often the specific product angles or modifiers that are gaining traction, before they appear in keyword tools.
-
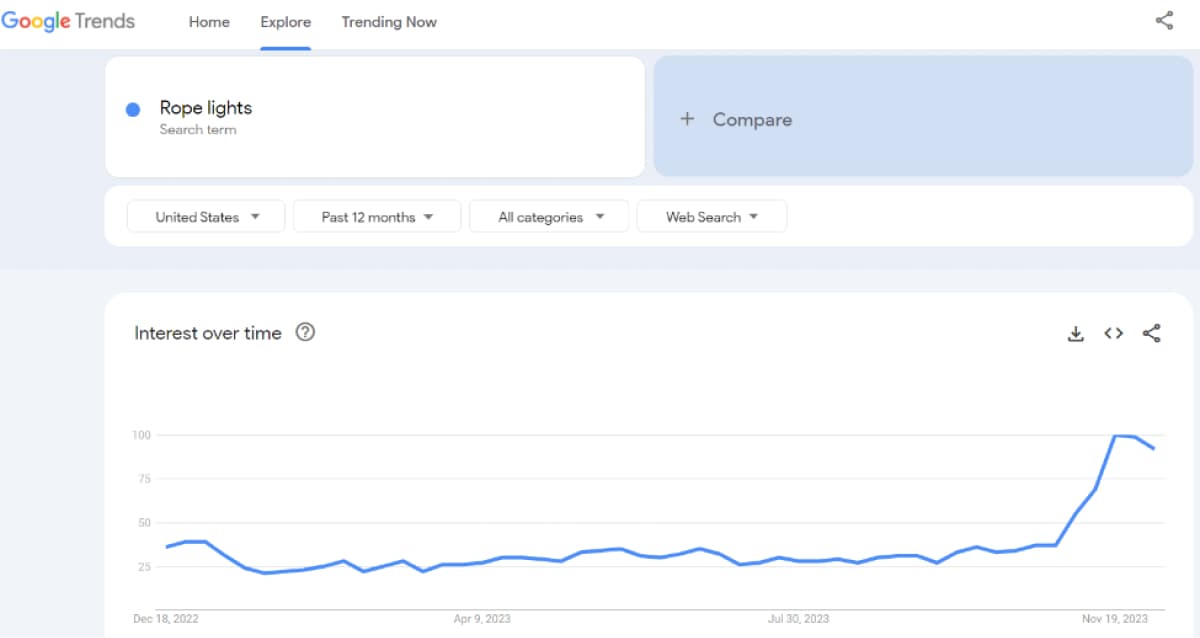
Compare terms: You can plot up to five terms on the same graph. This is helpful for picking between similar products (for example, rope lights versus LED strip lights) or comparing seasonal windows for two different niches.
-
"Trending now" and "Trending searches": Daily and real-time breakdowns of fast-moving search activity. Less useful for product research because the cycles are too short, but worth checking occasionally to catch sudden spikes from news or social coverage.
Why Timing Is the Central Problem Google Trends Helps Solve
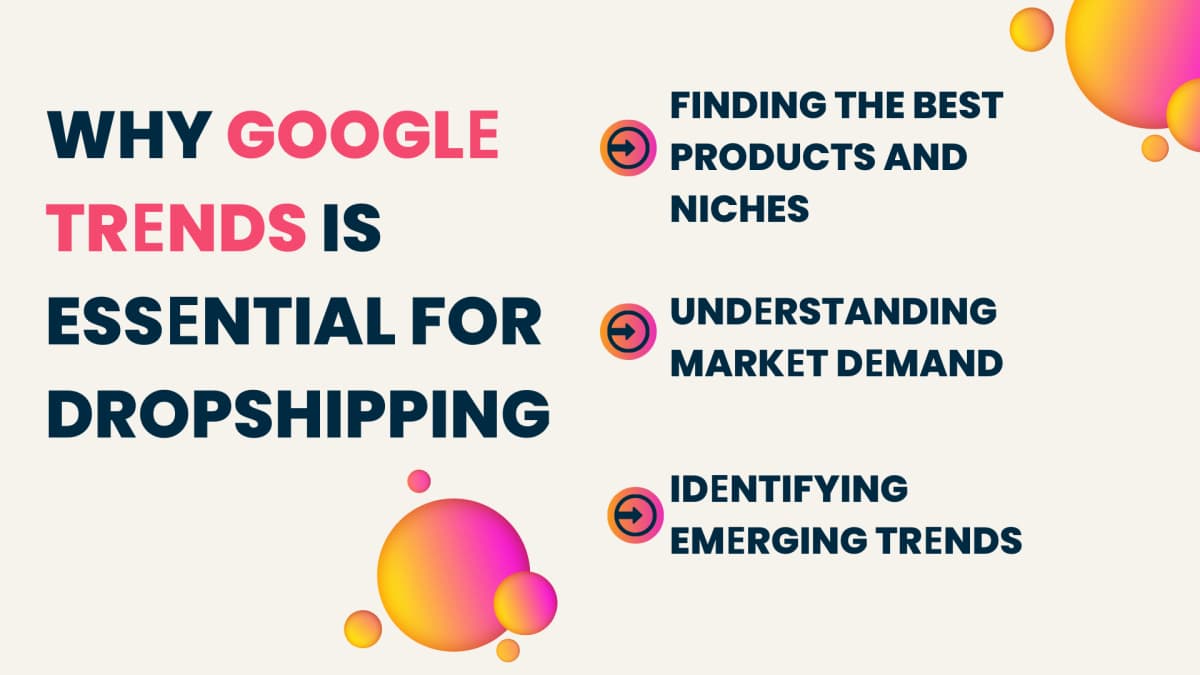
The structural challenge in dropshipping product selection isn't finding products that are popular. It's finding products that are gaining popularity before that fact is obvious. By the time a product appears on a bestseller list or in a viral TikTok compilation, competitors have already entered and margins are thinning.
Google Trends gives you an earlier signal. If a product's search interest has been climbing steadily for six months but hasn't yet attracted heavy ad spend or broad media coverage, you may still have a window. If it already peaked and is declining, the data tells you that too before you invest in inventory sourcing and store setup.
This is also why Trends data is worth checking even for categories with high baseline demand. Fashion accounts for over 34% of all dropshipping sales globally, but within that category, specific styles and items follow very different trend curves. Stainless steel drinkware saw a 90% jump in search interest over one year as the Stanley Cup phenomenon played out, while adjacent categories stayed flat. Trends lets you see those differentials.
How to Use Google Trends for Dropshipping
Access Google Trends and log in with your Google account. The interface is straightforward: a search bar at the top, filters for time range, geography, and category, and the time-series graph as the main output. Below the graph you'll find interest by subregion, related topics, and related queries.
Here is how to work through it systematically.
Step 1: Research Your Niche Before Committing to Products
Before searching individual products, use Trends to pressure-test the niche itself.
Enter a category term (for example, "portable blender" or "outdoor yoga mat") and set the time range to five years. What you want to see is either a stable flat line with consistent volume or a line that has been gradually rising. A sharp spike followed by a drop is a red flag: that product may have had a viral moment but didn't sustain organic demand afterward.
Also look at the subregion data. If interest in your niche is concentrated heavily in one city or one country, that tells you something about the likely audience. A product with broad geographic interest is generally safer for a dropshipping store without a fixed regional focus.
Search queries worth trying here:
- The category name alone ("yoga mat," "gaming accessories")
- Combined with your primary customer segment ("yoga mat home workout")
- The problem the product solves ("portable coffee maker travel")
Step 2: Validate Specific Products
Once you have a niche, move to individual products.
Enter the product name and look at the 12-month graph first. You want to see one of two patterns: (1) steady, consistent interest that confirms stable demand, or (2) an upward trajectory that hasn't flattened yet.
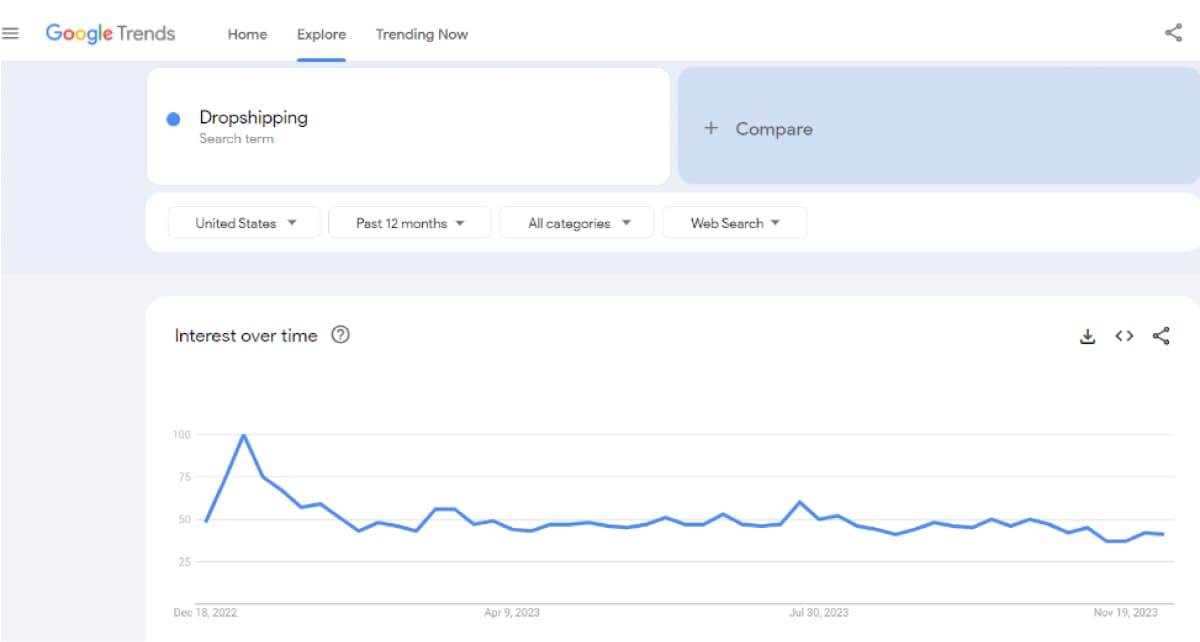
Avoid products that show a single sharp spike (often driven by one TikTok video or news cycle) with no follow-through. Those trend windows are often too short to source inventory, set up campaigns, and turn a profit before the interest drops.
For products with seasonal patterns, the 5-year view tells you how consistent the seasonality is. A product that spikes every December for five years in a row is predictable and plannable. One that spiked once in November three years ago is not.
Step 3: Find Keywords Through Related Queries
After validating a product, go to the Related Queries section and switch from "Top" to "Rising." Rising queries are where the real keyword intelligence lives.
These are terms that have increased significantly in search interest relative to the baseline, which means they are either new search behaviors or newly accelerating ones. For product listings and SEO, these are the specific phrases people are using right now, not just the generic category terms.
A few things to keep in mind when reading related queries:
- Filter out queries from competing products. If you are researching rope lights and a rising query is for a specific competitor brand, that is not a keyword opportunity for your store.
- Look for modifier terms: "best," "cheap," specific colors, specific use cases ("rope lights for bedroom," "rope lights outdoor waterproof"). These indicate buyer intent and are often less competitive than head terms.
- Note any declining terms in the Related Queries "Top" section. Those are keywords that have historically driven traffic but are losing relevance. Deprioritize them in your SEO work.
Step 4: Map Seasonal Patterns to Your Marketing Calendar
Identifying seasonal demand ahead of time is one of the clearest practical uses of Trends for dropshipping planning.
Set the time range to five years and look for any products in your niche that show repeating peaks. If you can identify that a product consistently rises in search interest in March and again in October, you can plan inventory sourcing, ad campaigns, and email promotions to match that cycle.
The practical rule: start prepping for a seasonal peak at least four to six weeks before it arrives. Sourcing, store setup, and ad creative all take time. Sellers who wait until the peak is already showing in real-time data are usually too late to capture much of it.
Step 5: Target the Right Regions With Ad Spend
If your Shopify store ships to multiple countries, the interest-by-region data helps you allocate ad budgets more precisely.
A product with high search interest in Australia but low interest in the UK means your testing budget goes further if you start with Australian audiences. This is especially relevant for categories where regional culture drives demand. Pet accessories, outdoor furniture, and seasonal kitchen products often show very uneven geographic distributions.
The same logic applies for SEO. If a product's interest is concentrated in North America, there is less point optimizing for UK-specific long-tail keywords until you have verified demand there.
Step 6: Compare Products Before Choosing
When you are deciding between two or three product candidates, the comparison feature gives you a clean head-to-head view.
Enter up to five terms and look at both relative volume and trajectory. The product with the most stable upward trend across multiple time windows is usually the safer bet, even if its current peak is lower than a competitor that is already declining. You want to be entering a market that is still growing, not one that already hit its ceiling.
Step 7: Use Related Queries for Content and Listing Ideas
The Related Queries section is useful beyond keyword research. It surfaces the specific language buyers are using, which you can apply directly to product descriptions, category page copy, and blog content.
If buyers consistently search "waterproof" alongside a product, lead with that in your title. If they search with a specific use case ("for van life," "for small apartments"), those modifiers belong in your product descriptions and alt text.
This is also how you build out blog content that captures traffic at different points in the buying journey. Related queries often reveal informational questions ("how to install rope lights") alongside transactional ones ("buy rope lights"), and both are content opportunities.
Step 8: Combine Trends With Competitor Intelligence
Google Trends tells you about demand. It does not tell you how saturated the market already is, what competitors are charging, or what their best-selling variants are. For that, you need to look at what's actually in stores.
Dropshippers can use our free Shopify Chrome extension, Koala Inspector, to do this research alongside Trends data. When you identify a product with strong Trends signals, Koala Inspector lets you look inside competitor Shopify stores to see their actual product lineup, bestsellers, pricing, apps they use, and how their traffic is structured.
Specifically, Koala Inspector helps you:
- See which products a competitor is actively promoting
- Evaluate pricing and product variants across multiple stores
- Check which apps competitors rely on for upsells, subscriptions, or conversion
- Identify best-selling items and bundle patterns
- Analyze how competitors structure their product pages
The combination matters because a product with rising Trends data is not automatically a business opportunity. You also need to know whether competitors are already well-established in that space. If established stores are doing well, there may be room for you. If the market is already saturated with deep-inventory players, Trends data alone won't save the margin.
Using Trends and Koala Inspector together closes that gap. Trends shows you the demand signal; Koala Inspector shows you the competitive context. Together they give you enough information to make a reasoned decision before sourcing inventory or spending on ads.
Common Mistakes When Using Google Trends for Dropshipping
A few patterns come up repeatedly among sellers who use Trends but still make poor product decisions:
Confusing a spike with a trend. A single high-interest data point, often from a news story or one viral video, looks identical to the start of a sustained trend on a short time window. Always check the 5-year view before concluding a product has durable demand.
Using Trends as a volume tool. The 0-100 scale is relative, not absolute. A product scoring 85 in Trends might have 500,000 monthly searches or 5,000. Trends tells you about trajectory, not size. Use it alongside a keyword volume tool, not instead of one.
Entering too late. If a product is already in the top Trends results for your category, the competition likely got there first. The advantage of Trends for dropshipping is catching the rise early, not confirming what everyone already knows.
Ignoring the category filter. By default, Trends includes all search categories. A search for "linen pants" will include searches related to linen fabric care or interior design. Filtering to the Shopping or Clothing category returns a much cleaner picture of actual buyer intent.
How Google Trends Fits Into a Larger Research Stack
Google Trends is a signal source, not a complete research process. Here's where it fits relative to other tools in a practical workflow:
- Trends shows directional demand and timing
- Keyword tools (Google Keyword Planner, Semrush) show absolute search volume and competition levels
- Competitor research tools (like Koala Inspector) show what is actually selling in live stores
- Ad libraries (Meta Ad Library, TikTok Creative Center) show what is currently being promoted, which indicates where sellers are putting money
Starting with Trends and then cross-checking against the other layers means you are validating demand from multiple angles before committing. That reduces the risk of spending time on a product that looks interesting in one data source but doesn't hold up across others.
Google Trends is free, fast, and available without an account for most functions. For dropshippers who are still building their research process, it is a solid first tool to add.

Written by
Ana Gelevska
eCommerce Content Writer
Ana Gelevska is a content writer with more than five years of experience creating content for eCommerce brands and global clients. She digs into each topic and the people it is for, then turns it into clear, useful articles that Shopify sellers and dropshippers can act on.
Connect on LinkedIn