Shopify Conversion Rate: Reverse-Engineer the Stores That Already Convert
 By Ana GelevskaJuly 10, 2026 · Updated August 26, 2026
The average Shopify store converts at 1.4 percent. Above 3.2 percent puts you in the best 20 percent, and above 4.7 percent puts you in the best 10 percent, according to Littledata's benchmark of 2,800 Shopify sites. What moves that number is rarely a clever headline. It is trust furniture, price clarity before checkout, and a product page that answers the question the shopper actually has.
Here is the part most CRO advice skips: the stores already converting at the top of your niche are readable from the outside. Their theme, their entire app stack, their review widget, their currency handling and their payment messaging are all visible to anyone who knows how to look. This guide shows you how to read them, then how to close the gaps that read reveals.
What a good Shopify conversion rate actually looks like
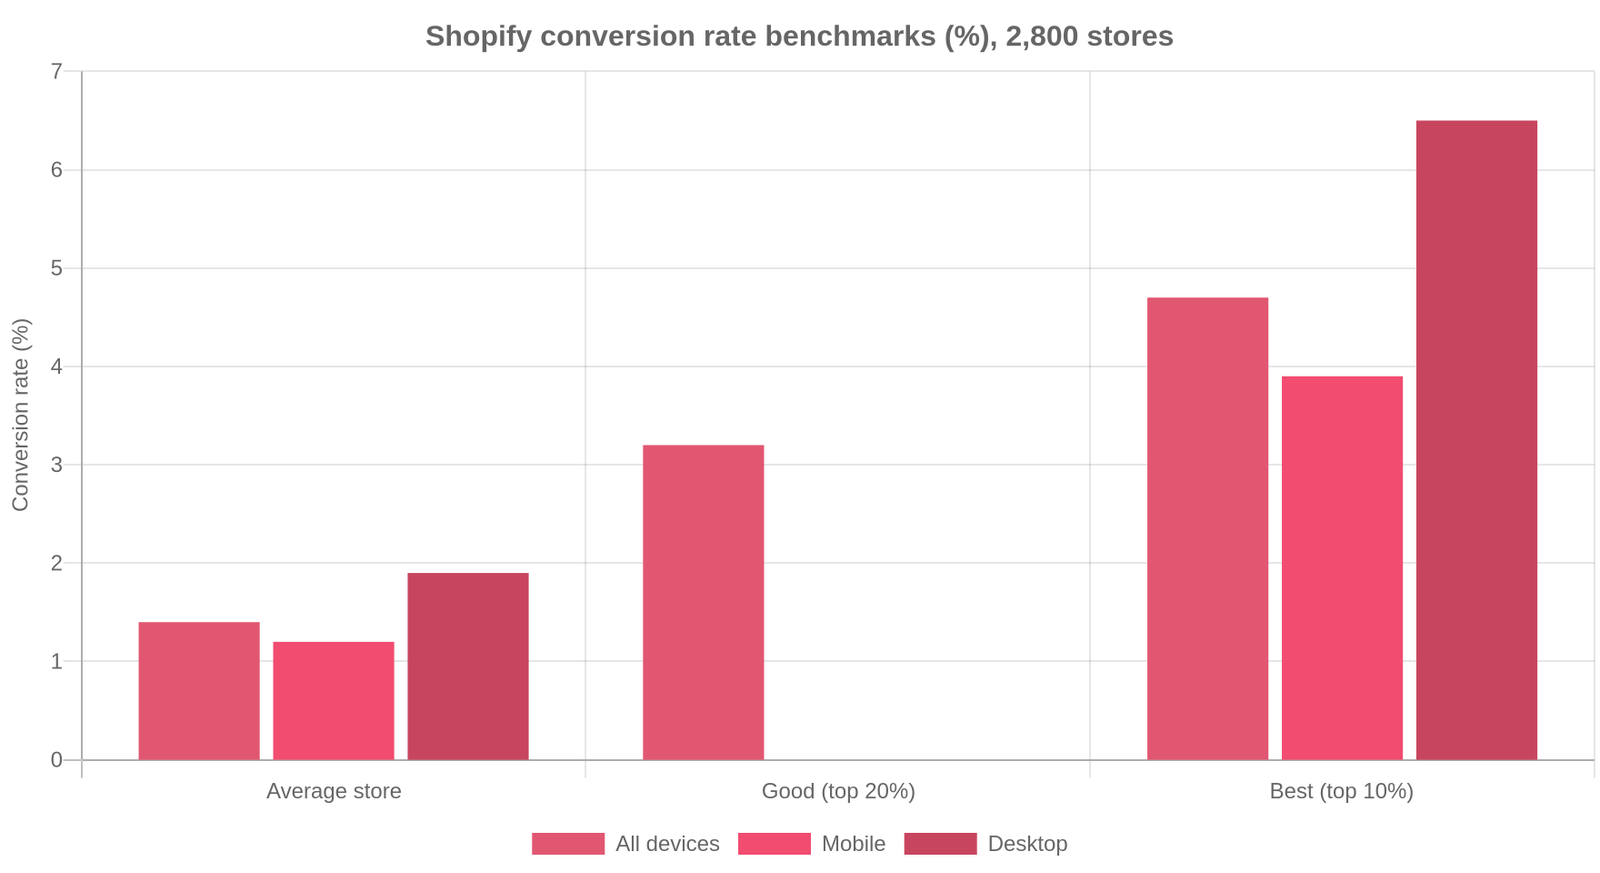
Littledata's figures split by device, and that split is where most self-diagnosis goes wrong. Mobile averages 1.2 percent and the best decile of stores manage 3.9 percent on mobile. Desktop averages 1.9 percent and the top decile clears 6.5 percent. A store running 80 percent phone traffic will post a blended number well under the headline average while every individual page performs normally for its device.
Category moves it too. Style and fashion average 1.9 percent, with 4.3 percent putting a store in the best 20 percent of fashion stores. Food and beverage average 1.5 percent, and the top decile reaches 6.2 percent. Travel sits at 0.2 percent. Benchmark yourself against your category and your device mix, then treat the gap as the size of the opportunity.
One more number sets the stakes. Baymard's rollup of 50 studies puts the average documented cart abandonment rate at 70.22 percent. Seven in ten people who add to cart leave. That is the pool you are fishing in.
The method: read a store that already converts

Pick three or four stores in your niche that are visibly doing well: the ones running ads you keep seeing, the ones ranking for your product terms, the ones with hundreds of reviews on their bestseller. Then open each one with the free Koala Inspector Chrome extension and read it.
Two of its detectors do most of the work here, and both cost nothing:
- The Shopify app detector lists every app the store runs, grouped by type. Reviews, email capture, upsells, page builders, currency switchers, order tracking. This is the store's conversion machinery, itemised.
- The Shopify theme detector names the active theme, paid and custom themes included, with a link straight to it in the theme store. If a competitor's layout converts, you can start from the same foundation instead of reinventing it.
Alongside them the store analyzer view gives you the catalogue, the price range, the likely best-sellers and the store's creation date, so you can see which products get the premium page treatment and how long the store has been at it.
A worked example
Take essencemakeup.com, a cosmetics brand that sits inside the top 300 stores by modelled traffic in Koala's own store data. Koala reads 15 installed apps on it, and its theme resolves to a heavily customised build of Dawn, Shopify's free flagship theme.
That single read kills two expensive assumptions in one go. The store is not winning on a $400 premium theme, and it is not winning on a bloated stack of 40 apps. It is winning on a free theme, customised, plus about fifteen deliberate choices. Across the top 300 stores Koala tracks, the median is 11 apps and the range runs from 0 to 39, so a store with a dozen well-chosen apps is the norm at the top rather than the exception.
Dawn is not an outlier either. Across the stores in Koala's theme data, Dawn is the second most common named theme, on 758 stores, behind only Trademark on 968. Horizon (376), Tinker (298), Impulse (288), Savor (283) and Rise (268) follow. Your theme is very unlikely to be the reason you convert at 0.8 percent.
Run three or four competitors through this and the pattern arrives fast. The same review app keeps appearing. The same payment-messaging banner keeps appearing. The apps that show up on every winner in your niche and on none of your pages are your fix list, ranked by other people's spending.
What the winners actually install, ranked
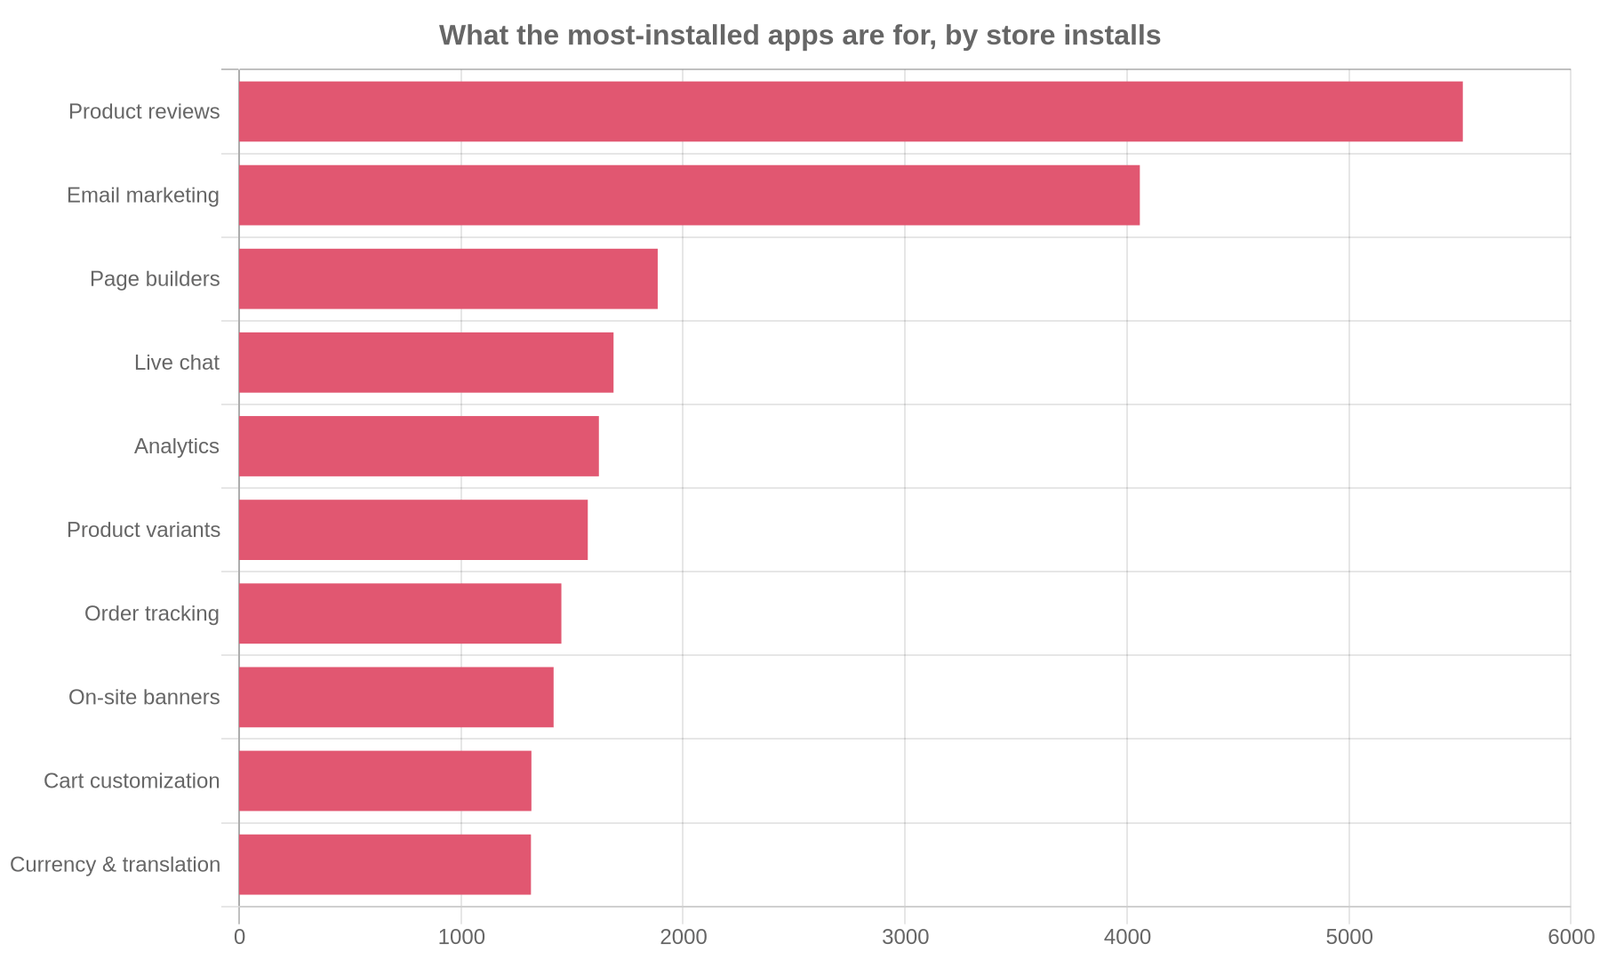
Rolling up the 250 most-installed apps across the stores Koala tracks, by what each app is for, gives you a demand curve for conversion problems. These are counts of store installs across the stores Koala tracks, not a census of all of Shopify, and they read as a ranking of what merchants pay to fix.
Product reviews lead by a distance: 5,513 store installs across 19 review apps, with Judge.me on 2,520 stores, Product Reviews on 804 and Loox on 768. Email marketing is second at 4,058, led by Klaviyo on 1,839. Then page builders (1,886, PageFly on 861), live chat (1,687, Shopify Inbox on 1,095), analytics (1,621, Microsoft Clarity on 799), product variants (1,571), order tracking (1,452), on-site banners (1,417, Klarna's on-site messaging on 1,106), cart customization (1,317) and currency plus translation (1,315).
Read that list as a diagnosis of where money leaks, written by thousands of merchants with their own budgets.
The leaks, in the order they bite
1. Nobody trusts you yet
Reviews are the single most-installed category for a reason. A first-time visitor has no history with your brand, and Baymard's breakdown of why people abandon (setting aside the ones just browsing) puts 19 percent on "I didn't trust the site with my credit card information" and 13 percent on an unsatisfactory returns policy.
The fix is unglamorous and it works. Get real reviews on the product page, not a badge. Publish the returns policy where a hesitant buyer will find it, which is next to the buy button rather than in the footer. Make a human reachable. Chat apps are on 1,687 store installs in Koala's data because a shopper with one unanswered question is a shopper who leaves.
2. The price is not the price
40 percent of abandoners in Baymard's data left because extra costs (shipping, tax, fees) were too high, and another 12 percent because they could not see or calculate the total order cost up front. This is the biggest single line in the whole abandonment breakdown, and it is a display problem before it is a pricing problem.
Publish shipping cost on the product page. If your margins carry a free-shipping threshold, put the threshold in the cart with the amount remaining. On-site payment messaging sits on 1,417 store installs among the top apps, Klarna's alone on 1,106, because splitting a $120 order into instalments visible before checkout changes what the price feels like.
3. The product page cannot answer a question
Product variant apps show up on 1,571 store installs, which is a strange number until you have watched a shopper pick a colour and get the wrong photo. In a Shopify Community thread on the biggest conversion problems merchants face, one reply described exactly this failure mode: a shopper clicks "Navy Blue / Size Medium", the image does not switch to the navy photo, and conversion drops instantly due to shopper hesitation.
The same thread surfaced a quieter one. A customer-insight lead at a large DIY retailer flagged sold-out variants: "Those sessions don't look like a conversion problem, they look like normal bounces, so they never show up in the funnel." Measure how much of your product page traffic lands on something unbuyable before you change anything else.
Page builders sit on 1,886 store installs, PageFly leading on 861. Merchants buy them to control section order on the pages that carry the money. Our product page teardown breaks that order down block by block.
4. You are not watching the drop-off
Analytics apps are on 1,621 store installs, with Microsoft Clarity's session-replay tool on 799 stores by itself. A reply in that same community thread made the case better than a vendor page could: "the biggest mistake is trying to fix conversion before knowing where the drop-off actually happens", followed by watching a handful of real sessions to spot people missing the CTA or getting stuck on product pages.
Fix your biggest drop-off. Changing ten things at once is how a store spends a month and learns nothing.
5. Delivery anxiety kills the last click
20 percent of Baymard's abandoners left because delivery was too slow. Order tracking apps carry 1,452 store installs in Koala's data across six apps, because the fix is partly expectation-setting: put the delivery window on the product page, not in the confirmation email.
6. Nothing catches the people who leave
Seven in ten carts get abandoned no matter how good your store is. Email marketing is the second-biggest category in Koala's data at 4,058 store installs, and dedicated abandoned-cart apps add another 522. A store with no capture and no recovery flow is paying for traffic once and using it once.
What sellers say about Koala Inspector
Verified reviews from the Chrome Web Store.
“Super simple to use and gives tons of detail of other stores. It helped me learn how to improve my store.”
 Jessica Walker
“Awesome customer support. Insights into store AOV, products, traffic and campaign tracking is extremely helpful!”
 Gabe Abramovich
“Invaluable for competitive insights, Koala Inspector is easy to navigate and helps stay ahead in the Shopify marketplace.”
 Merico Monaldo
The diagnostic you can run this week
Five passes, one a day. The first three cost nothing.
Monday: benchmark by device. Pull your conversion rate split by mobile and desktop and compare each against 1.2 and 1.9 percent. Then compare against your category. Write down the gap.
Tuesday: read three competitors. Open three higher-converting stores in your niche with Koala Inspector. Note the theme, and note every app in the reviews, email, upsell, variants and currency categories. Build one table: their apps, your apps, the difference.
Wednesday: audit your price display. Load your own top product on a phone. Time how long it takes to learn the shipping cost. If the answer is "at checkout", you have found your 40 percent.
Thursday: watch the drop-off. Install a session-replay tool and watch ten real sessions on your best-selling product. Note where hands hesitate. Check what share of product page traffic lands on a sold-out variant.
Friday: ship one fix. The biggest gap from Tuesday's table or Thursday's replays. One change, then leave it alone long enough to read the result.
Two more habits pay off after week one. Add your best competitors to Koala Inspector's shop tracking so you get told when they swap a theme, add an app or change a price, which is a free feed of the tests they are running for you. And check the ads a competitor runs so the promise in their ad matches the landing page you are studying.
FAQ
Shopify conversion rate FAQ
The questions store owners ask when the number is not moving.
What is a good Shopify conversion rate?+
Littledata benchmarked 2,800 Shopify sites and found an average of 1.4 percent. Above 3.2 percent puts you in the best 20 percent of stores, and above 4.7 percent puts you in the best 10 percent. Read the number by device before you judge it: mobile averages 1.2 percent and desktop 1.9 percent, so a mostly-mobile store looks worse on a blended figure even when nothing is broken. Category matters too, with fashion averaging 1.9 percent and food and beverage 1.5 percent.
Are there free online theme detectors?+
Yes. Koala Apps runs a free online Shopify theme detector that takes a store URL in the browser with nothing to install, and the free Koala Inspector Chrome extension identifies the active theme of whatever store you are already looking at, including paid and custom themes, with a link to that theme in the theme store. Theme detection is one of Koala Inspector's permanently free features, so you can read a competitor's foundation before you spend anything.
Can I use my own domain name with Shopify?+
Yes. Shopify gives every store a myshopify.com address and lets you connect a custom domain you buy through Shopify or transfer in from another registrar. It matters for conversion because a branded domain removes one of the first trust objections a cold visitor raises. Worth knowing before you panic about it: plenty of large stores in Koala's own store data still run on their myshopify.com address, so treat a custom domain as a trust upgrade rather than a blocker.
Can I use Shopify's ecommerce platform to sell internationally?+
Yes, and the stores that do it well pay for the plumbing. Across the stores Koala tracks, currency and translation apps account for 1,315 store installs among the 250 most-installed apps, putting them in the same weight class as cart and checkout tooling. Showing a shopper prices in their own currency and copy in their own language removes two silent conversion killers on international traffic, and a mismatch between ad currency and checkout currency is a common cause of a healthy add-to-cart rate with no completed orders.
Are Shopify point of sale payments secure?+
Shopify POS processes card payments through Shopify Payments on PCI-compliant hardware and infrastructure, so card data is handled by the payment processor rather than sitting in your admin. The conversion lesson carries straight to your online store: Baymard found that 19 percent of shoppers who abandoned a cart did so because they did not trust the site with their credit card information, so visible, recognisable payment options earn real money on the storefront as well as at the counter.
Are you ready to upgrade to Shopify Plus?+
Judge readiness on volume and on what your current plan is actually blocking, rather than on ambition. If your conversion rate still sits under the 1.4 percent Shopify average, a bigger plan buys nothing that a fixed product page and a visible returns policy would not. Read the stack of the stores in your niche that already sit at the top first. In Koala's data the top 300 stores it tracks run a median of 11 apps, so most of what reads as enterprise polish is ordinary apps used well.
Anyone have any recommendations for relatively easy-to-learn consignment software that integrates seamlessly with Shopify?+
The Shopify App Store carries consignment and vendor-payout apps that sit on top of your existing catalogue, and the fastest way to shortlist one is to find a consignment or resale store already running on Shopify and read its installed apps with the free Koala Inspector app detector. That tells you what shops in your exact model chose and kept, which is stronger evidence than a review-score ranking written by someone who never handled your inventory. Check two or three such stores and the shortlist writes itself.
How long does it take to move a Shopify conversion rate?+
Trust and cost-clarity fixes can move the number within days because they remove friction at the moment of purchase: publish shipping cost earlier, surface real reviews, put the returns policy next to the buy button. Structural work like rebuilding the product page or changing theme takes longer to read and needs enough traffic to prove out. Change one thing at a time so the result is attributable to something.
Stop guessing and start reading
Your conversion rate has a cause, and in most niches somebody nearby has already solved it and left the evidence sitting on their storefront. Benchmark by device, read three winners, and rebuild the two or three pieces you are missing. Install Koala Inspector free and turn the best store in your niche into a blueprint this week.
Sources
- Littledata, average ecommerce conversion rate for Shopify - the 1.4 percent average, the 3.2 and 4.7 percent thresholds, the mobile and desktop splits and the fashion and food figures, from a benchmark of 2,800 Shopify sites, read 26 August 2026.
- Baymard Institute, 50 cart abandonment rate statistics - the 70.22 percent average documented abandonment rate across 50 studies, and the reason breakdown (40 percent extra costs, 20 percent slow delivery, 19 percent card trust, 13 percent returns policy, 12 percent no visible total), read 26 August 2026.
- Shopify Community, "What's the biggest conversion problem you've faced on your Shopify store?" - the variant image and sold-out variant failure modes, and the find-the-drop-off-first advice, read 26 August 2026.
- App install counts, theme counts, store app counts and the essencemakeup.com read come from Koala's own store intelligence, covering the stores Koala tracks rather than all of Shopify.
Written by
Ana Gelevska
eCommerce Content Writer
Ana Gelevska is a content writer with more than five years of experience creating content for eCommerce brands and global clients. She digs into each topic and the people it is for, then turns it into clear, useful articles that Shopify sellers and dropshippers can act on.
Connect on LinkedIn