The one-line answer: a Shopify store's monthly revenue is roughly its monthly traffic multiplied by its niche conversion rate multiplied by its average product price. Plug those three numbers into the checker above and you get a working estimate in seconds. To pull real traffic and pricing for a specific store instead of guessing the inputs, we use Koala Inspector, the free Chrome extension. You can also compare tools in our full list of competitor spy tools.
What a revenue estimate actually tells you
A revenue estimate is a size and momentum signal, not a bank statement. It answers two questions fast: is this store big or small, and is it growing or slowing. That is enough to decide whether a competitor is worth studying, whether a niche has real money in it, and which stores to model your own on. Treat the number as a benchmark you compare against, not a figure to quote to the penny.
The reason store owners never share these numbers is obvious. Revenue is the scoreboard, and nobody hands a rival their scoreboard. The formula below reverse-engineers it from inputs that are public.
How to read a revenue range over time
One estimate is a snapshot. The value shows up when you read it as a range across time.
- Check the same store on a schedule. Look at a store monthly for most niches, weekly for fast movers like fashion and electronics where catalogs and ad spend swing quickly.
- Watch the direction, not the decimal. A rising estimate means momentum, so their offer, ads, or products are working right now. A flat or falling one means a competitor is stalling and there is room to take share.
- Compare stores side by side. Two stores in the same niche, read the same way, tell you who is pulling ahead. That relative read is far more reliable than any single absolute figure.
Koala Inspector keeps a running view of each store you follow, so you can spot the trend instead of re-checking by hand.
What's the eCommerce revenue formula?
The formula is: traffic x conversion rate x average product price = estimated revenue. If a store gets 20,000 visitors a month, converts at 5%, and sells an average product for $80, its monthly revenue is roughly $80,000.
Breaking that example down:
- Traffic: 20,000 Shopify sessions
- Conversion rate: 5%
- Average product price: $80
20,000 x 5% x $80 = $80,000 (monthly revenue)
The three inputs, and how to find each
Each input is measurable, and each one you can find for any Shopify store.
1. Traffic
Shopify calls visits "sessions." Traffic generally comes from three places: paid search, social media ads, and organic search. Stores that run Google Ads show up on branded and category keywords and usually disclose ad copy that signals their best-performing offers. Social ads on Meta or TikTok drive spikes but get expensive at scale. Organic search takes longer to build but delivers steadier month-to-month sessions with no per-click cost. Most stores that hit six figures use a mix of all three.

2. Conversion rate by niche
Conversion rates swing hard by category. According to SmartInsights, gifts convert at around 4.9%, automotive parts around 2.2%, and consumer electronics around 1.4%. The pattern holds up: lower-priced, impulse-friendly products convert higher than high-consideration, high-ticket ones.
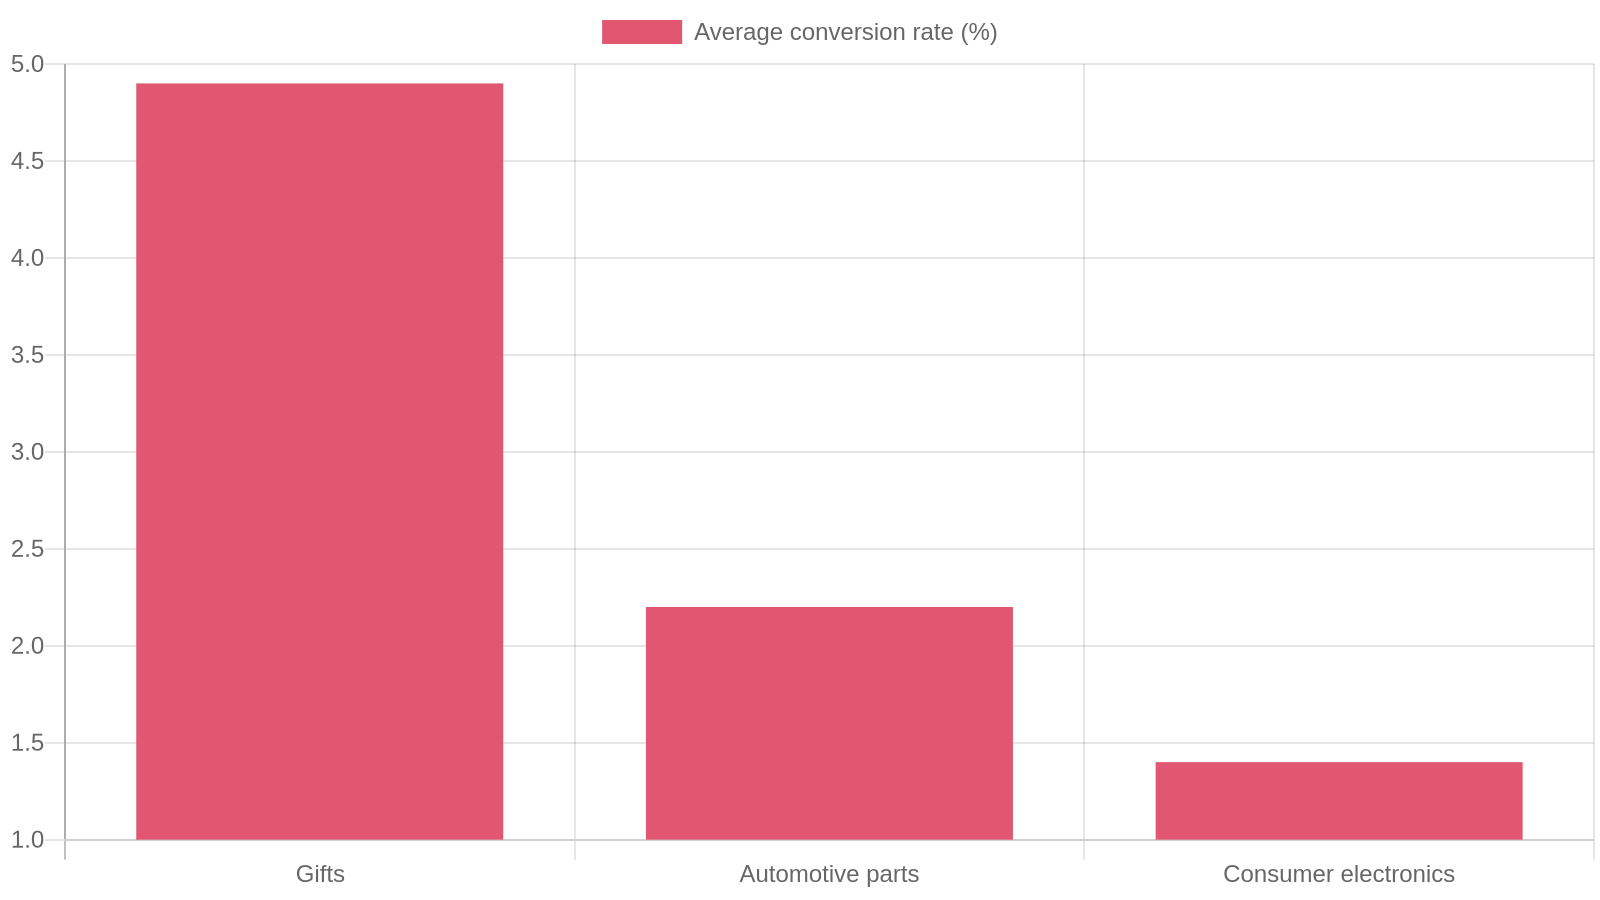
Knowing your niche's benchmark tells you how realistic an estimate is. If a consumer electronics store supposedly converts at 4%, something in the math is off. If your own store sits far below benchmark, that is where to focus.
Gifts
Gift stores convert well because purchases are often time-sensitive, a birthday or a holiday, and the decision is quick. A clear occasion, good photography, and fast-shipping messaging cover most of what pushes a visitor to buy.
Apparel and footwear
Apparel is one of the highest-converting categories online. Shoppers buy clothes without trying them on, especially with free returns. Shein, Nike, H&M, ASOS, and Zara compete on price, speed, and trend cycles. For smaller Shopify sellers, speed-to-market on trending styles beats breadth of catalog.
Sports
Sports and outdoor gear converts steadily because buyers usually know exactly what they want: a specific shoe size, a jersey, a piece of kit. Niche stores focused on a single sport can win where the big retailers do not go deep.
Jewelry and cosmetics
Jewelry holds its value and cosmetics see high repeat purchase rates, so both perform well by conversion. High-ticket jewelry takes longer to convert but carries better margins. Cosmetics convert faster and often see strong email reactivation after a first purchase.
3. Average product price
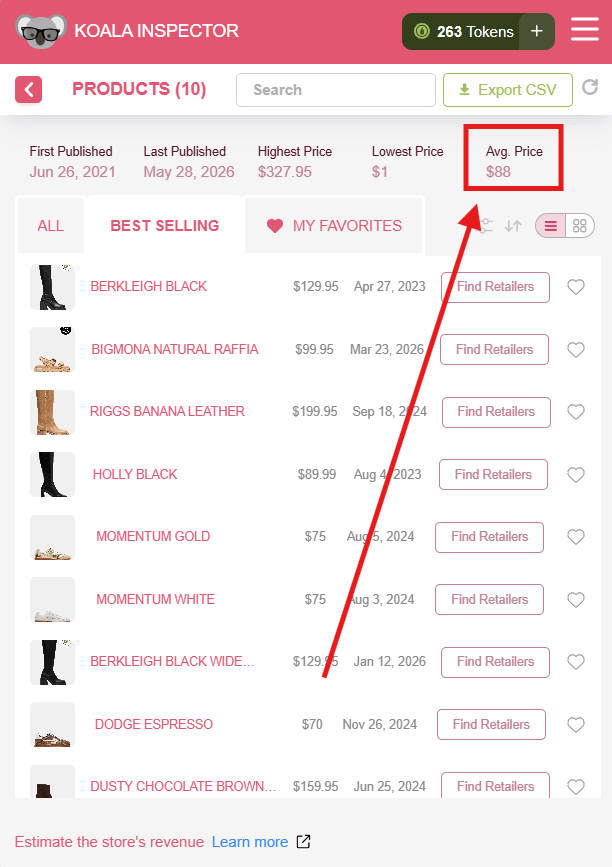
Average product price tells you what a store's customers actually pay. Most Shopify stores land around an $85 average order value, from under $60 for early-stage stores to $200 or more for premium, high-ticket brands. Stores with a higher average order value can afford more traffic spend and still hold margins. You can read the average product price from any Shopify store directly with Koala Inspector.
Revenue is not profit
One thing the formula does not show is take-home. Shopify stores typically run net profit margins around 10% after product cost, ads, and fees, so a store doing $80,000 in monthly revenue is not pocketing $80,000. When you size up a competitor, read the revenue estimate as top-line scale, then remember most of it goes back out the door.
How to check a Shopify store's revenue (video)
Checking a store live is faster than doing the math by hand. Here is a creator walking through exactly that: opening a Shopify store and reading how much it is doing, then reverse-engineering what is working.
The steps are simple:
- Install Koala Inspector from the Chrome Web Store. It takes under a minute.
- Open any Shopify store in Chrome. Koala detects it and surfaces the store's signals on its own.
- Read the estimated sales and traffic, the average product price, and the best-selling products in one view.
- Follow the store over a few weeks to watch the trend, not just the snapshot.
Find any competitor's Shopify revenue
Store owners do not publish revenue, but the three variables in the formula are all findable. Koala Inspector is a Chrome extension built for exactly this. Install it, open a competitor's store, and it surfaces estimated traffic, average product price, best-sellers, and top apps in one view, all modeled from the public signals any visitor's browser can already see. Over 90,000 Shopify sellers use it for this kind of research. There is a free plan, with paid plans for deeper data.